Sensory Systems · Unit 7: Smell and taste
Taste from Tongue to Cortex
Taste cells are not neurons, so how does a quality such as sweet or bitter get from a taste bud to the amygdala? The lesson follows the code from the geniculate ganglion to cortex in mice, asks how narrow the afferent code really is, and separates what a taste is from how much the animal wants it. Afterwards you can read a tuning-breadth data set, say what each genetic or optogenetic experiment does and does not show, and design the control that would settle a disputed result.
Watch first A Synapse Made of a Channel · 2:39
Image the geniculate ganglion of an anaesthetized mouse one neuron at a time, and most of the neurons that respond at all answer strongly to just one of the tastes you offered. Does that make taste a set of labelled lines from tongue to cortex?
Smell and taste gave you the cells and receptors, and sensory coding gave you the labelled-line and population ideas. This lesson starts where they stop: at the afferent fibre, at the synapse that is built from a channel, and at everything central to the geniculate ganglion. Everything below is a mouse result unless it says otherwise, and none of it is a human map.
One quality per fibre, or one at a time
The geniculate ganglion holds the cell bodies of the facial-nerve sensory neurons that supply taste buds on the front of the tongue and palate. Barretto and colleagues (Nature, 2015) put a GRIN microendoscope (a thin lens that relays light from deep tissue) over it in anaesthetized mice of both sexes aged 2 to 12 months, and recorded GCaMP calcium signals from many neurons while tastants flowed over the tongue. Most responding neurons were strongly activated by one tested quality. Neurons that preferred the same quality showed no obvious spatial clustering in the ganglion.
They also silenced the taste cells that express PKD2L1 and looked at the neurons that respond to both bitter and sour. That class was still there. So in this preparation, the bitter-sour response did not simply depend on input from those cells.
Now the counter-weight. Wu, Dvoryanchikov, Pereira, Chaudhari and Roper (Nature Communications, 2015) imaged geniculate neurons in anaesthetized mice and compared low with higher stimulus concentrations. Tuning broadened as concentration rose. “Narrow” is therefore a statement about a stimulus panel and a concentration range, not about the neuron alone. For the wider labelled-line against population argument, see sensory coding; this lesson only asks what the data allow.
Worked problem: does a broader population mean broader neurons? In the data of Wu and colleagues, 28 of 101 recorded geniculate neurons responded to more than one taste at the low concentration panel, and 79 of 155 did so at the mid-range panel. Call a neuron multiply responsive if it responded to more than one taste in the panel.
Step 1, fractions. Low: 28 / 101 = 0.277, or 27.7 percent. Mid-range: 79 / 155 = 0.510, or 51.0 percent.
Step 2, difference. Computed from the unrounded fractions, 51.0 minus 27.7 is 23.2 percentage points (subtracting the rounded values gives 23.3, a rounding effect).
Step 3, ratio. 0.510 / 0.277 = 1.84, so the multiply responsive proportion was about 1.84 times as high (the raw counts differ by 79 / 28 = 2.8, but the cohorts are different sizes).
Step 4, what the numbers cannot say. These are two sampled cohorts. The arithmetic shows that the population looked broader, not that any single neuron broadened, and neurons from a few animals are not independent replicates. Only a within-neuron comparison at low and high concentration tests that, which is the design Wu and colleagues used.
A synapse made of a channel
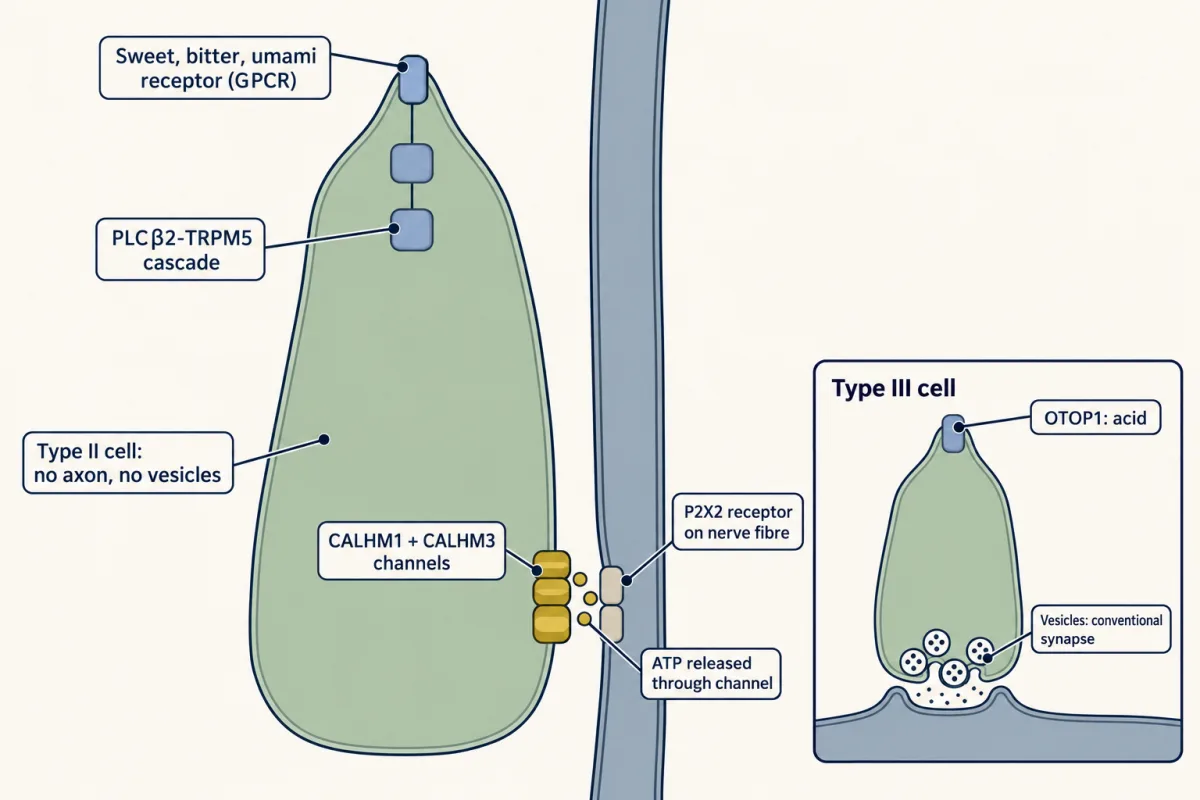
Type II taste cells detect sweet, bitter and umami through G-protein-coupled receptors and a PLCβ2-TRPM5 cascade (see PLC, IP3, DAG and PKC, G proteins and calcium signalling). They have no conventional vesicular synapse. Instead the depolarized cell releases ATP through a channel.
Taruno and colleagues (Nature, 2013) found that CALHM1 is required for taste-evoked ATP release from mouse type II cells, using Calhm1 knockout mice, isolated cells and taste tissue, nerve recordings and behaviour. Sour and salty taste recognition was mostly normal in the assays they tested, which fits release by a different route in those cells. It does not mean that sodium signalling never uses CALHM channels: Nomura and colleagues (Neuron, 2020) reported that deleting Calhm3 abolished the amiloride-sensitive sodium component of nerve responses.
A puzzle remained. CALHM1 alone is slow. Ma and colleagues (Neuron, 2018) deleted Calhm3 in mice and found that taste-evoked ATP release from taste buds was abolished. In mouse N2a neuroblastoma cells recorded by whole-cell voltage clamp, CALHM1 alone activated with a time constant above 500 ms, while CALHM1 coexpressed with CALHM3 activated in about 10 ms. That is a speed-up of more than fifty-fold (500 / 10), although the exact times depend on voltage and protocol. This is a property of cultured cells, not a delay measured in a living animal.
Romanov and colleagues (Science Signaling, 2018) used serial block-face scanning electron microscopy, which reconstructs a contact in three dimensions by imaging and shaving a tissue block repeatedly. They reported that CALHM1 channels in mouse type II cells cluster in membrane patches facing nerve fibres that carry the ATP receptor P2X2, with atypical mitochondria pressed against the cell membrane beside them. They proposed that the mitochondria supply ATP locally. The images show geometry; the case for a mitochondrial ATP source also rests on indirect pharmacology (oligomycin eliminated depolarization-evoked ATP release).
Type III cells are different. They make conventional synapses onto fibres, and they transduce acid through OTOP1. In Otop1 knockout mice, acid-evoked taste-nerve responses were severely attenuated, though not necessarily absent (Teng and colleagues, Current Biology, 2019; ). OTOP1 is not exclusive to type III cells: a 2024 study of epitope-tagged endogenous OTOP1 (Journal of Neuroscience) reported that it is not restricted to type III cells, and its function in other cells is unresolved. Larson and colleagues (Journal of Neuroscience, 2015) reported that type III serotonin acting on 5-HT3 receptors is a significant component of the signal to mouse gustatory fibres, and that pentobarbital apparently blocked that signalling, so what you see depends on the anaesthetic. Which cell supplies the ATP needed during sour signalling is, so far as these papers go, still open.
Fields in cortex, or no fields
Chen, Gabitto, Peng, Ryba and Zuker (Science, 2011) bulk-loaded a calcium dye into the insular cortex of anaesthetized mice and imaged it with two-photon microscopy. They reported separate fields for sweet, bitter, umami and sodium, and did not locate a sour field. That is a gustotopic (taste-quality-ordered) map, in anaesthetized mice, within the regions sampled.
Chen, Kogan and Fontanini (Current Biology, 2021) imaged superficial insular cortex in alert, licking mice with two-photon and widefield calcium imaging. They found distributed taste responses. The two results differ in state and sampling, so they do not simply contradict each other, but neither one is a human map, and a tidy field diagram should not be taught as settled.
Fields would matter more if they did something. Peng and colleagues (Nature, 2015) expressed channelrhodopsin in the sweet or bitter field in awake mice. Light on the sweet field drove attraction and light on the bitter field drove aversion in the behavioural assays used. They also trained mice to treat bitter as go and sweet as no-go, an arrangement that opposes the animal’s innate preference. That this was learnable suggests that recognition of the taste is not simply tied to its innate value. The experiments show sufficiency of the driven field for those behaviours. They do not show that the animal “experiences” sweetness, and they do not show that cortex is the only place taste is represented.
Identity and value come apart in the amygdala
Wang and colleagues (Nature, 2018) traced the two fields in male mice. Sweet cortex projected to the anterior basolateral amygdala; bitter cortex projected predominantly to the central amygdala, with some terminals in the posterior basolateral amygdala. They then silenced the amygdala. The attraction elicited by stimulating sweet cortex was abolished, while the mice still reported sweet and bitter correctly in the trained recognition tasks.
Read that carefully. Silencing the amygdala changed expressed valence, the pull toward or away from a taste, and left trained recognition intact, in these assays and with this silencing method. It does not show that the amygdala handles all learning about taste, or that taste identity lives in cortex alone. It does give you a clean experimental pattern: manipulate one stage, then measure two different behaviours, and see which one moves. That pattern is how motivation and reward are separated from perception throughout the nervous system.
Taste that depends on what the body needs
A fixed value for each taste would be neat, and it is not what the data show. Zocchi, Wennemuth and Oka (Nature Neuroscience, 2017) reported that silencing acid-sensing taste cells removed water-evoked taste-nerve responses in mice, and that water-deprived mice licked for light activation of those cells even when no water was delivered. This did not happen with food deprivation or salt depletion. Wilson, Vandenbeuch and Kinnamon (eNeuro, 2019) stimulated cells in a PKD2L1-IRES-Cre line crossed to a channelrhodopsin reporter and did not see sustained light-directed drinking. The two papers differ in driver line (a BAC transgene in one, an IRES-Cre knock-in in the other), which may change how strongly and in which cells the channel is expressed.
Lee and colleagues (Nature, 2019) studied pre-locus-coeruleus prodynorphin neurons in mice. Inhibiting them reduced sodium intake. Oral sodium rapidly suppressed their activity, while intragastric NaCl infusion did not in the same acute comparison; GABAergic neurons of the bed nucleus of the stria terminalis partly mediated the suppression. The gastric comparison covers only a short window and does not exclude slower feedback from the gut. For how the hypothalamus reads body state, see hypothalamus and autonomic control.
Tongue chemistry also is not the whole of sweetness. Tan and colleagues (Nature, 2020) found that silencing a gut-to-brain circuit in mice prevented the development of sugar preference; Buchanan and colleagues (Nature Neuroscience, 2022) reported glutamatergic signalling for sugar and purinergic signalling for sweetener in CCK-labelled duodenal neuropod cells. Those circuits are taught in gut-brain sensing and vagal sensory neurons. Forward, the next unit asks how senses combine in multisensory integration and prediction.
Design problem
One laboratory reports that water-deprived mice lick for light-driven activation of acid-sensing taste cells, but not when food- or salt-deprived. A second laboratory, using a different driver line, sees no sustained light-directed drinking. Design the experiment that would settle it, and say what each outcome would and would not show.
One way to do it
Match the tools. Use the same driver and reporter in both lines, or put both side by side in one study. Count how many cells of which type are targeted in each line, since a driver labels cells that expressed it at some time, not a pure type. The two results may differ because different cells were reached.
Match the conditions. Use the same light parameters and the same deprivation state, and include a within-animal comparison of light-triggered licking against licking for water, so each mouse acts as its own control. Compare water deprivation, food deprivation and salt depletion, plus a fully replete condition.
Measure nerve and behaviour in the same animals. Record the taste-nerve response to the light to confirm the cells are driven, then measure licking in those animals.
Read the result at its scope. If light-directed licking appears only under thirst in matched lines, the manipulation shows that activating those cells can direct licking in thirsty mice. It does not show a sixth human taste, and it does not show that the animal was rehydrated, since light delivers no water. If it does not appear, the first result may reflect a different driver population.
How we measure it
GRIN microendoscope and confocal calcium imaging
A thin gradient-index lens relays fluorescence from deep tissue, or a confocal microscope images exposed tissue, while a genetically encoded calcium indicator such as GCaMP reports neuronal activity. It records dozens of geniculate neurons at once, but responses depend on the stimulus panel, concentration and the criterion for calling a cell responsive.
Optogenetic stimulation with behavioural assays
Light-gated channels are expressed in a chosen cell population and activated by light while the animal licks, moves or performs a trained task. It tests whether driving those cells is enough to change a behaviour in that assay, and trained go and no-go tasks help separate recognition from preference.
Whole-cell voltage clamp and ATP release assays
A cell's membrane potential is held fixed while its channel currents are recorded, and a luciferin-luciferase assay reads out ATP released into the bath. Together they link a channel subunit to gating kinetics and to transmitter release.
Serial block-face scanning electron microscopy
A block of tissue is imaged and shaved in repeated thin steps to reconstruct cell contacts in three dimensions. It shows the arrangement of a contact and its organelles but does not by itself measure how much transmitter crosses it.
Finish line
Test yourself
8 questions
Practice and MCAT-style, with explained answers.
Next · Lesson 29
Combining Senses and Predicting Them
You cannot tickle yourself, yet a mouse's Pacinian afferents fire strongly to its own movements. Where does the cancellation happen?
Continue →