Biology · Unit 6: Evolution
Variation and Survival
Why do some individuals survive and reproduce while others do not, and what does that do to a population? You will run a model population under a pressure you control, then read real data on tuskless elephants in Mozambique and on how many young blue crabs and elephants produce. Afterwards you can explain where variation comes from, why only some offspring survive, and what before-and-after data can and cannot show.
Where this lesson sits
- Virginia SOL BIO.7b
- Practices BIO.1a, BIO.1b, BIO.1c, BIO.1d, BIO.1f
Essential question: Why do some individuals survive and reproduce while others do not, and what does that do to a population?
-
Life Science (grade 7) LS.11 c and LS.10 b
Review it at grade 7 level
In Life Science you learned that variations in a population happen randomly. A variation may help an organism, harm it, or make no difference. Both the environment and inherited traits shape what an organism is like. You also learned that the type of reproduction matters: one parent makes offspring that are nearly the same, while two parents make offspring that vary. Organisms whose traits suit their environment are more likely to survive. In Biology you add where new variations come from, why most young do not survive, and how a strong pressure can change a population quickly.
-
Biology BIO.7b You are here
This lesson
-
Biology II Biology II: Advanced Survey of Biology Topics, BIOII.5 a and b; Ecology, EC.5 c
Preview where it goes next
In Biology II: Advanced Survey of Biology Topics, you name selective pressures such as predators, disease, climate and human harvesting, and measure relative fitness: how many offspring one variant leaves compared with another. You also see why genetically diverse populations are more likely to have some members that survive a change. The Ecology course sorts species along a range from fast reproduction with many small young and little care to slow reproduction with few, large, cared-for young, often called r- and K-selected species. It adds survivorship curves, which show at what ages most members of a population die, and connects these patterns to the pressures a species faces.
-
College
Watch first Who Survives Changes the Population · 2:57
In Mozambique’s Gorongosa National Park, ivory poachers hunted elephants during a civil war that lasted from 1977 to 1992. Before the war, about 1 in 5 of the females researchers sampled had no tusks; among the females that survived the war, about half had none. No elephant lost her tusks. So how did the population change? The answer depends on two facts: individuals differ, and not all of them survive.
What do you think? Decide before you read.
-
Scientists disagree: An elephant’s tusks are set by the genes she was born with. What changed was the population: researchers compared photos of females from before the war with females seen afterwards. Tuskless females were already present before the war and survived poaching more often, so their share of the population rose.
What scientists think
Scientists disagree: An elephant’s tusks are set by the genes she was born with. What changed was the population: researchers compared photos of females from before the war with females seen afterwards. Tuskless females were already present before the war and survived poaching more often, so their share of the population rose.
-
Scientists disagree: Natural selection needs no wanting or trying. Variations arise by chance, from mutations and from the reshuffling of alleles in reproduction, whether or not they help. When the environment changes, individuals that happen to carry a helpful variation survive and reproduce more often. Field studies, such as moths released on tree branches, measure this difference in survival directly.
What scientists think
Scientists disagree: Natural selection needs no wanting or trying. Variations arise by chance, from mutations and from the reshuffling of alleles in reproduction, whether or not they help. When the environment changes, individuals that happen to carry a helpful variation survive and reproduce more often. Field studies, such as moths released on tree branches, measure this difference in survival directly.
-
Scientists disagree: Different variants usually keep living side by side. In Gorongosa, about half of the females that survived the war still had tusks, and most daughters born after the war had tusks. Evolution is a change in how common a variant is in a population, not every member changing together.
What scientists think
Scientists disagree: Different variants usually keep living side by side. In Gorongosa, about half of the females that survived the war still had tusks, and most daughters born after the war had tusks. Evolution is a change in how common a variant is in a population, not every member changing together.
Explore: put a population under pressure
In this model you watch a population of animals with an inherited trait, such as having tusks or not, over many generations. You set how strong a pressure is, such as how often hunters take tusked animals, and whether new variations can arise by mutation. A graph tracks what share of the population has each trait.
| Expected | This run (simulated) |
|---|
In this sketch: 100 animals per generation. Each tusked animal is taken with a chance of 5 percent per pressure unit (so 25 percent at 5); animals with no tusks are not taken. The survivors make the next 100 young, and each young copies the trait of one survivor chosen at random. With new variation on, 1 in 200 young of a tusked survivor is born with no tusks. These rates are the sketch’s own relative settings, not measurements, and one parent per young simplifies real inheritance.
An animal keeps the trait it was born with. What changes from generation to generation is how common each trait is in the population, and it changes faster under a stronger pressure. This is a sketch of the logic, not a prediction for any real herd.
Try this.
- Set the pressure to zero. Predict whether the share of tuskless animals will rise, fall or wobble. Run it several times.
- Turn the pressure up to strong. Predict how many generations it takes for the share to change a lot. Then try a weak pressure and compare.
- Start with no tuskless animals and new variation switched off. Predict what strong pressure does. Then switch new variation on.
- Follow one animal through its life. Predict whether its trait changes before it dies.
Explain: where variation comes from
- variation
- allele
- gene pool
- mutation
- gene flow
- sexual reproduction
- natural selection
- selective pressure
- reproductive strategy
Look around a classroom. People differ in height, hair, voice and much more. Some of those differences are inherited, and some come from the environment, such as food or exercise. Only inherited differences pass to the next generation.
Variation is the differences among individuals in a population. An allele is one version of a gene. The gene pool is all the alleles of all the individuals in a population. Three processes add to or reshape it.
- Mutation is a change in an organism’s DNA. It is the original source of new alleles. Many mutations have no effect, some harm, and a few help, depending on the environment. In animals, only mutations in cells that make eggs or sperm pass to offspring.
- Gene flow is the movement of alleles from one population to another, when individuals move and breed or when pollen blows to another field. It can bring in an allele the population did not have.
- Sexual reproduction joins an egg and a sperm from two parents. You saw in Meiosis and Variation that meiosis shuffles chromosome pairs and swaps pieces between them. This makes new combinations of alleles that already exist, so each offspring is a new mix.
Over many generations, mutations build up. As they do, and as gene flow adds and removes alleles, the gene pool changes.
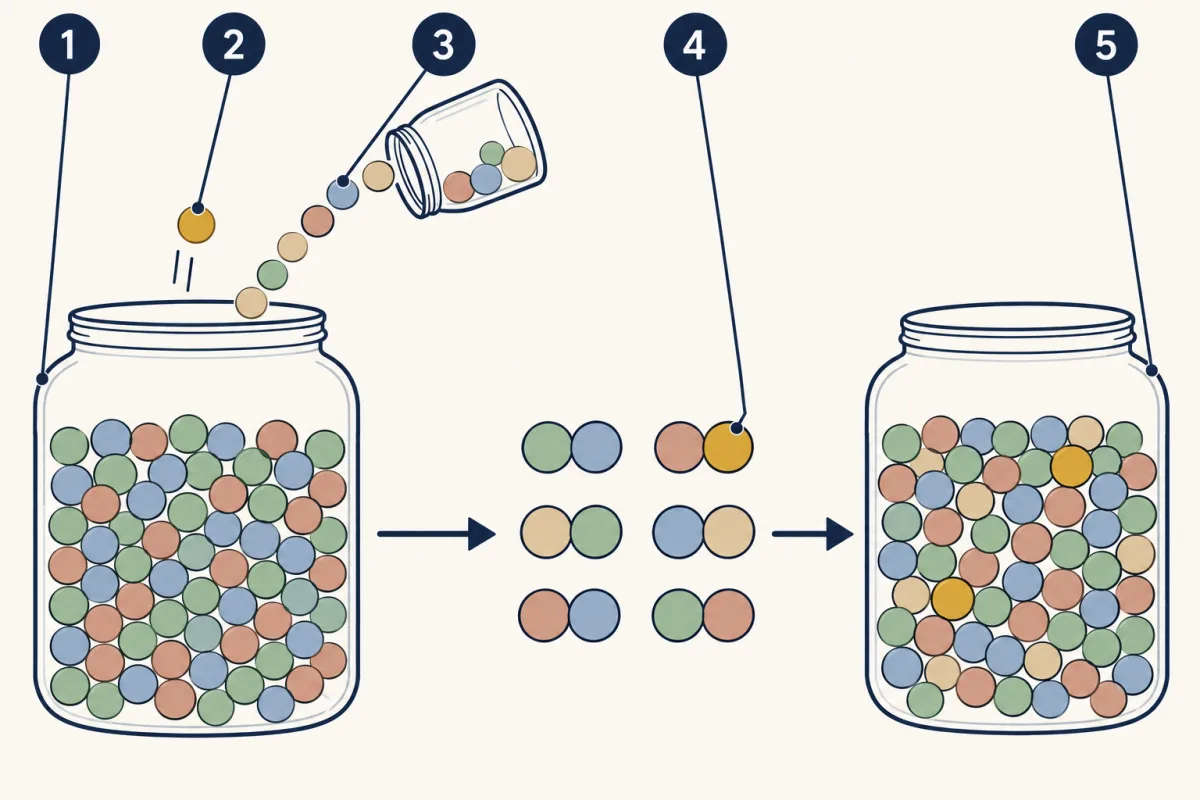
- gene pool
- mutation
- gene flow
- meiosis and fertilization
- one generation later
- gene pool
- mutation
- blank
- blank
- blank
Word bank: gene flow, meiosis and fertilization, one generation later
- blank
- blank
- blank
- blank
- blank
Check your labels
- gene pool
- mutation
- gene flow
- meiosis and fertilization
- one generation later
A bead jar is a helpful picture of a gene pool. The picture has a limit, because real alleles are carried inside living animals, so they leave the jar mainly when those animals die, fail to reproduce, or move to another population.
Explain: more young than can survive
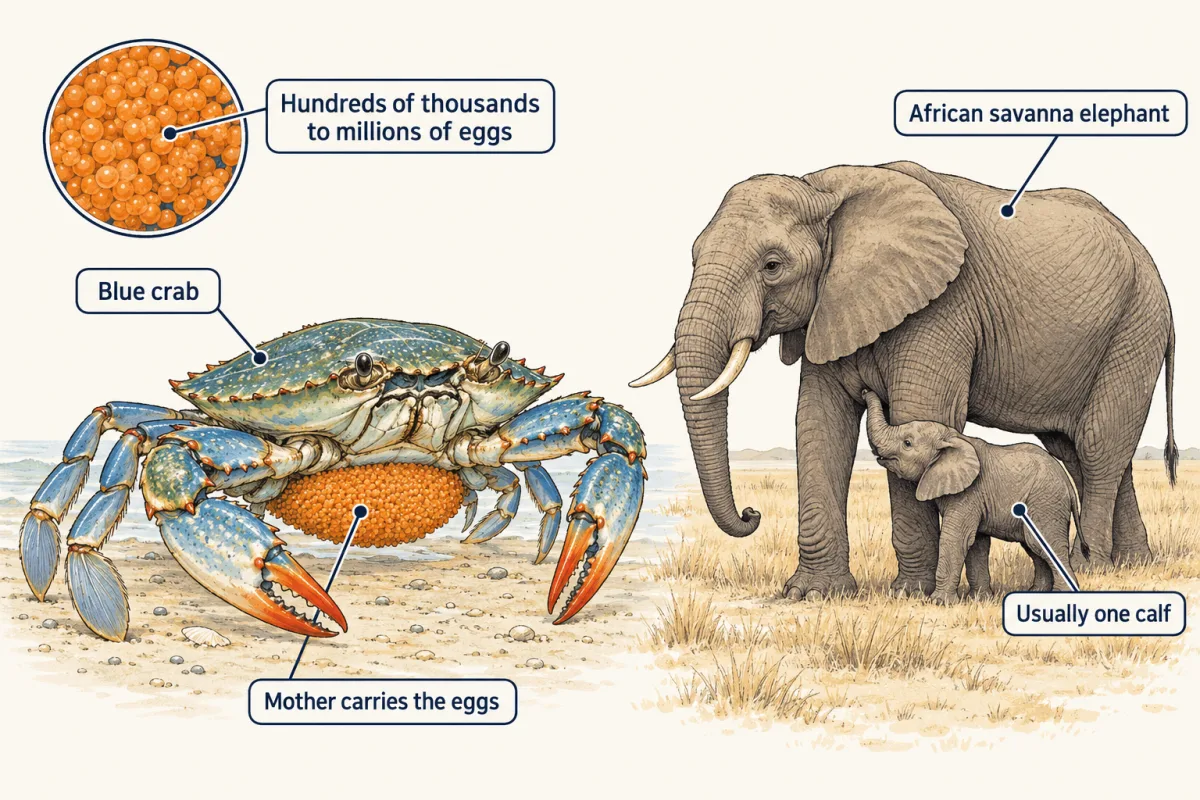
Populations tend to make more young than the environment can support. A female blue crab in the Chesapeake Bay may carry an egg mass of about 750,000 to 8 million eggs, according to the Virginia Institute of Marine Science. Only a small fraction of those eggs become adult crabs. Most die young.
Natural selection is the process by which individuals with certain inherited variations survive and reproduce more than others, so those variations become more common in later generations. Strength alone does not decide it. What counts is how many offspring an individual leaves.
A selective pressure is anything in the environment that makes some variants more likely to survive than others: predators, disease, drought or human hunting. In Gorongosa, poachers wanted ivory, so tusked elephants were killed more often. Tuskless females already existed, and they survived more often. The researchers concluded that poaching most likely caused strong selection for tusklessness.
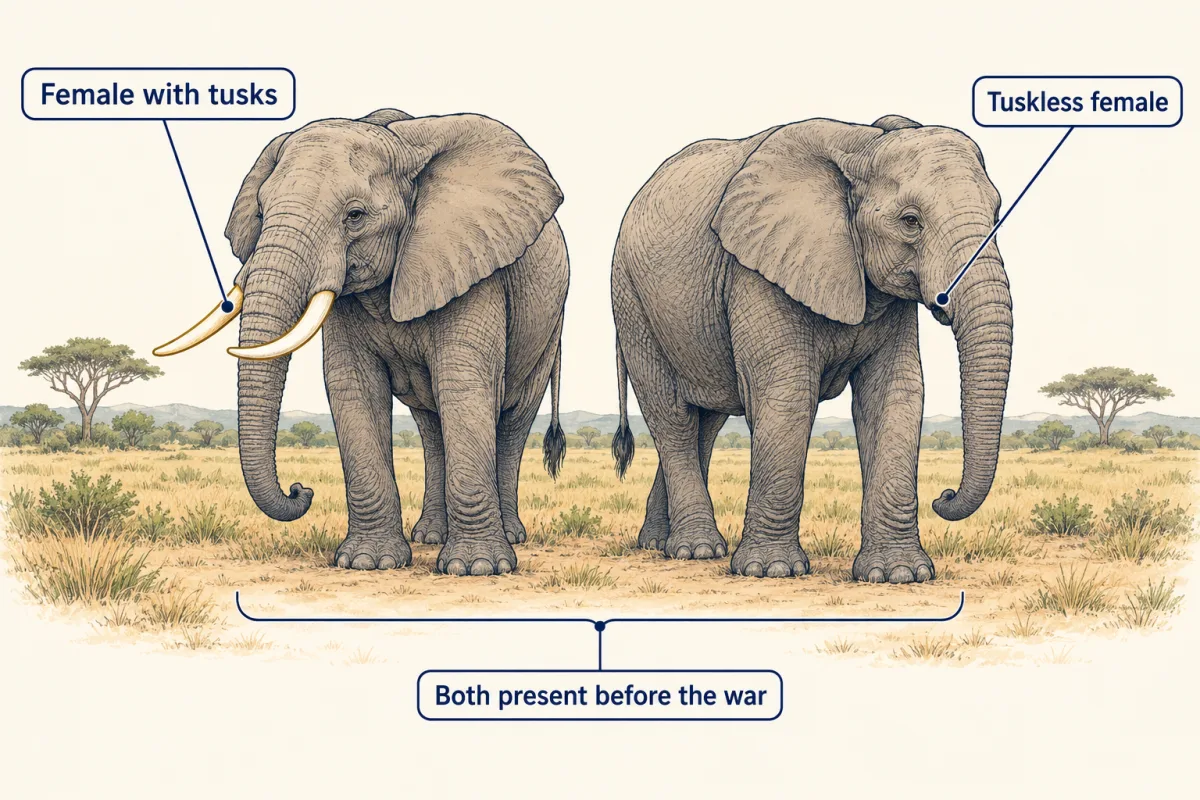
Pressure can be strong or weak. A strong pressure, like heavy poaching, can change a trait’s frequency within a few decades. A weak pressure changes it slowly over many generations. Biologists argue about how often evolution happens in quick bursts and how often it creeps along; you will meet those two ideas in Natural Selection and New Species.
A reproductive strategy is a species’ pattern of how many young it makes and how much it invests in each. The table compares two endpoints.
| Blue crab | African savanna elephant | |
|---|---|---|
| Young per breeding | Hundreds of thousands to millions of eggs | Usually one calf |
| Care | Mother carries the eggs until they hatch | Mother nurses the calf, and births are years apart |
| Survival of each young | Very low | Higher |
Many species fall between these endpoints, so treat them as the ends of a range rather than two boxes.
Elaborate: read the elephant and crab data
| Measure | Value | Units | Group or place |
|---|---|---|---|
| Tuskless females, before the war | 18.5 (54 females) | percent | Gorongosa, before 1977 |
| Tuskless females, war survivors | 50.9 (108 females) | percent | Gorongosa, survived 1977 to 1992 |
| Tuskless daughters, first generation after the war | 33 (91 females) | percent | Gorongosa, born about 1995 to 2004 |
| Elephants in the park, all ages and sexes | 2,542 | elephants | Gorongosa, 1972 count |
| Elephants in the park, all ages and sexes | 242 | elephants | Gorongosa, 2000 count |
| Time between births, mean | 4.5 | years | Amboseli, Kenya (255 females) |
| Time between surviving calves, median | 3 | years | Gorongosa (124 intervals) |
| Blue crab egg mass, low end of reported range | 750,000 | eggs | Chesapeake Bay |
| Blue crab egg mass, high end of reported range | 8,000,000 | eggs | Chesapeake Bay |
Sources: tusk percentages and park counts from Campbell-Staton and colleagues, Science (2021), Figure 1 (the paper’s text gives 52 prewar females, its figure 54). Amboseli births from Moss, Journal of Zoology (2001), a study begun in 1972. Gorongosa calf intervals from Poole and Granli, Pachyderm (2022), field trips 2011 to 2019. Egg mass range from the Virginia Institute of Marine Science, a summary range, not one dated sample.
- By how many percentage points did the share of tuskless females rise from before the war to the survivors?
- Why might the daughters’ share (33 percent) be lower than their mothers’ generation (50.9 percent)?
- Compare the two elephant interval values. Why might they differ?
Claim, evidence, reasoning
Make a claim about why tuskless females became more common in Gorongosa, using these data.
Start with: Tuskless females became more common because blank.
Start with: Before the war blank percent of sampled females were tuskless, and among survivors blank percent were.
Start with: Poachers killed tusked elephants more often, so blank, and because tusklessness is inherited, blank.
Compare with a model answer
Tuskless females became more common because poaching for ivory killed tusked elephants more often, so tuskless females were more likely to survive. In the prewar sample, 18.5 percent of 54 females were tuskless; among 108 war survivors, 50.9 percent were, a rise of 32.4 percentage points. The share among daughters born after the war, 33 percent, is still above the prewar 18.5 percent, which fits an inherited trait. The data have limits: the samples are small, the percentages count a visible trait rather than alleles, and they cannot prove what happened to each elephant or which gene causes the trait.
Saved in this browser only.
Design problem
Plan an ethical study to test whether hunting, not chance, explains the rise in tuskless females in a park. You cannot assign hunting to elephants. What groups would you compare, what would you count, and what could mislead you?
One way to do it
- Question: Did tuskless females become more common in parks with heavy poaching than in parks with little poaching?
- Comparison groups: several parks with heavy poaching and several with little poaching, with photos or counts from before and after the same years.
- What you count: the number of adult females with and without tusks in each park and period. Report the number of animals, not only the percentage.
- Constants: the same definition of “tuskless”, the same age range of females, and observers trained the same way.
- Sample size and repeats: as many recognized females as possible, and more than one park in each group, because one small sample can change by chance.
- What could mislead you: old photos may show some animals more than others, and tuskless elephants may be easier or harder to spot. Recording each known individual once helps.
- Ethics: observe and photograph only; never harm animals to test an idea.
A larger rise in heavy-poaching parks than in low-poaching parks would support selection by hunting.
Evaluate: check your thinking
No Gorongosa elephant lost her tusks. Tuskless females were already part of the population, and poaching killed tusked elephants more often, so tuskless survivors left more of the next generation. The population changed because some individuals survived and reproduced while others did not.
Science practices you used: making predictions and testing them with a model, reading a table of percentages and sample sizes, calculating a change in percentage points, planning an ethical observational study, and naming the limits of small samples and of a model.
How we measure it
Photo surveys of known animals
Researchers compare old photographs and film with sightings of animals today and record a trait, such as whether a female elephant has tusks. Counting the trait in each group gives a percentage for that group, and comparing groups shows whether the trait became more common.
Long-term records of known individuals
Field teams learn to recognize individual animals and follow them for years, writing down births and deaths. These records give numbers such as the average time between a mother's calves.
Genome scanning
Scientists read DNA from many animals with and without a trait and look for regions that differ between the two groups. A region that stands out is a candidate for the cause; more work is needed to show that it is the cause.
Finish line
Test yourself
8 questions
Practice and MCAT-style, with explained answers.
Next · Lesson 28
Natural Selection and New Species
After a drought killed most of the medium ground finches on one small island, why did the birds that were left have deeper beaks?
Continue →