Organismal Biology · Unit 1: Organisms and their diversity
Size, Scale and Surface
Why can a flatworm get by with no lungs and no heart while a mouse cannot? This lesson works through the geometry of size: how the ratio of surface to volume falls as a body grows, why diffusion is fast over micrometres and hopeless over centimetres, and how metabolic rate scales with body mass. Afterwards you can calculate a surface-area-to-volume ratio and a diffusion time, predict total and per-kilogram metabolic rates from a power law, and say what a fitted scaling exponent does and does not tell you.
Watch first Bigger Bodies, Less Surface per Volume · 3:03
A widely used fit predicts that a 30 g mouse at rest burns roughly 5 kilocalories a day, and a 70 kg adult human about 1,700. The human is more than 2,000 times heavier but burns only about 340 times as much. Each kilogram of mouse spends about seven times more energy than each kilogram of human. To see why, and why the mouse has lungs and a heart while a flatworm needs neither, you have to look at what happens to surfaces when bodies get bigger.
Everything a cell or a body takes in or gives out crosses a surface. Oxygen enters, carbon dioxide and heat leave. This lesson builds on what an organism has to do and asks how size changes the job.
A bigger cube has less skin per unit of inside
The surface-area-to-volume ratio is a body’s outer area divided by the volume it encloses. Model a cell as an ideal cube of side s. Its surface area is 6s² (six square faces) and its volume is s³, so
surface area / volume = 6s² / s³ = 6/s
For a sphere of radius r the same reasoning gives 4πr² / (4/3 πr³) = 3/r. Either way, the ratio falls as size rises. It also has units: area divided by volume is per unit length.
Worked problem, part 1. These cubes are illustrative, not measured cells.
- Side 10 um. Area = 6 x 10² = 600 um². Volume = 10³ = 1,000 um³. Ratio = 600 / 1,000 = 0.6 per um.
- Side 20 um. Area = 6 x 20² = 2,400 um². Volume = 20³ = 8,000 um³. Ratio = 2,400 / 8,000 = 0.3 per um.
- Compare. Doubling the side multiplies area by 4 and volume by 8, so the ratio halves. Check with 6/s: 6/10 = 0.6 and 6/20 = 0.3.
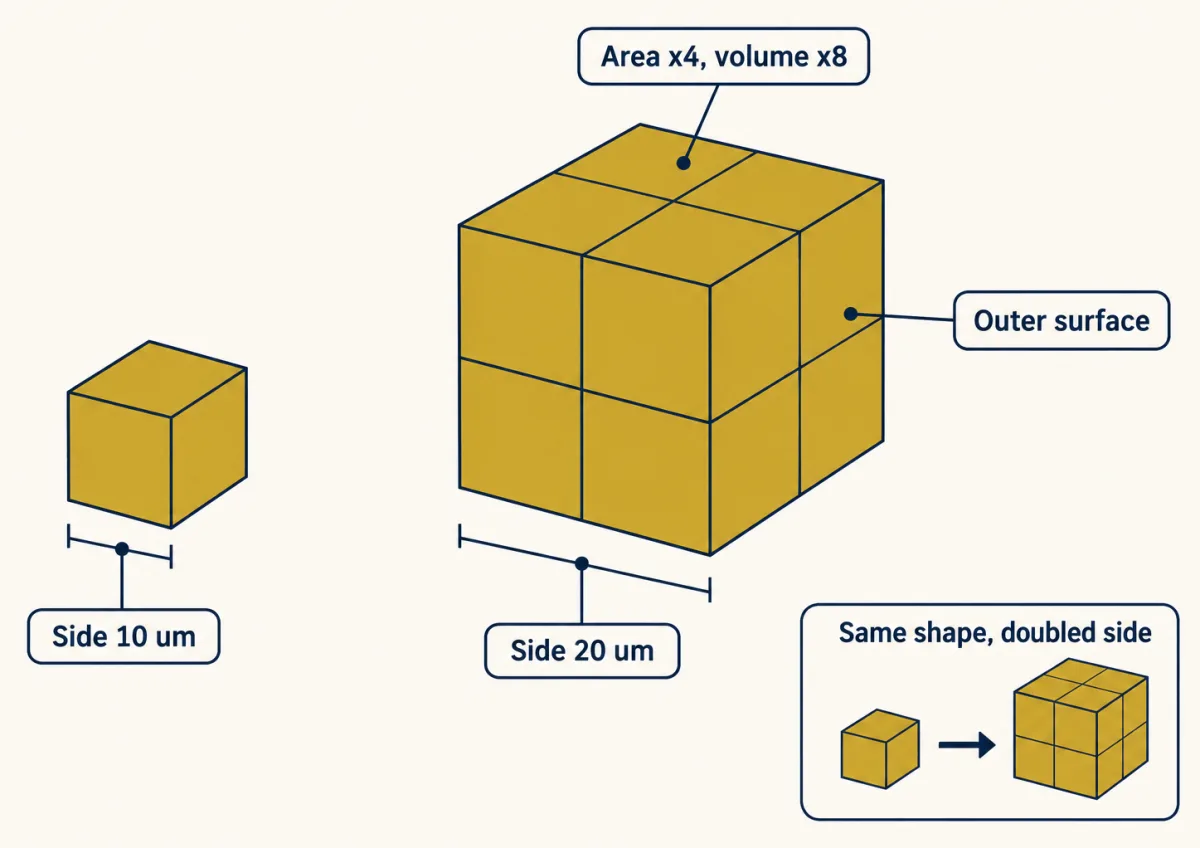
The bigger cube has more surface in total and less surface for each cubic micrometre that needs supplying. If oxygen use scales with volume and oxygen entry with area, there is a size at which entry can no longer keep up. For real cell sizes and shapes, see the measured eukaryotic cell.
Diffusion: fast over micrometres, hopeless over centimetres
Diffusion is the net spread of molecules from where they are more concentrated to where they are less, driven by their random motion. How fast it spreads is set by the diffusion coefficient, D. For a small molecule in water, D is about 1,000 um² per s. How molecules cross membranes is covered in membrane transport; here the question is distance.
In a simple model of free diffusion along one direction, the mean squared distance a molecule travels is 2Dt. Rearranged, the typical time to cover a distance L is
t = L² / 2D
Worked problem, part 2. Take D = 1,000 um² per s, a small solute in water.
- L = 5 um (half the 10 um cube). t = 25 / 2,000 = 0.0125 s.
- L = 10 um (half the 20 um cube). t = 100 / 2,000 = 0.05 s, four times as long for twice the distance.
- L = 1 cm = 10,000 um. t = 100,000,000 / 2,000 = 50,000 s, about 14 hours.
Because time grows with distance squared, diffusion that is effectively instant across a cell becomes useless across a finger’s width. Treat these as rough estimates: the formula gives a typical spread along one coordinate, not the time to fill a cell or the first moment a molecule arrives.
That is why size without some other transport is limited. Many flatworms, such as freshwater planarians, have flattened bodies, and oxygen reaches their tissues by diffusion across the body surface. A flat body keeps every cell close to the outside. A mouse-sized animal built like a sphere could not be supplied that way.
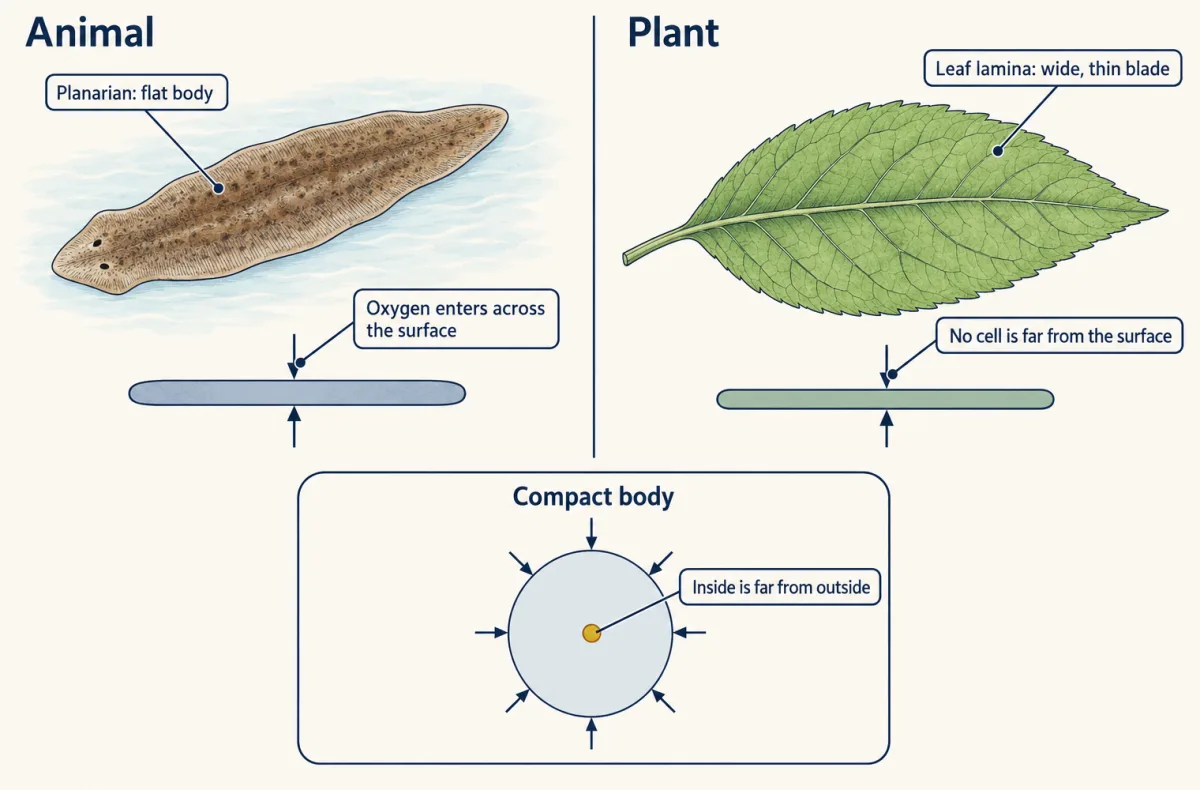
Four answers in two kingdoms
Animals and plants face the same geometry, and the same four solutions turn up in both.
Flattening. The planarian is one example. The blade, or lamina, of a typical eudicot leaf is another: a wide, thin sheet in which no cell is far from the surface.
Folding. The mammalian lung packs a large exchange surface into the chest by folding it into a very large number of small air sacs, the alveoli. How much exchange is possible depends on that area divided by the thickness of the barrier. Leaves fold inward too. Their mesophyll, the photosynthetic tissue inside the leaf, is full of air spaces. Using X-ray microCT, Mathers and colleagues (2018) measured 21.3 mm² of exposed mesophyll surface per mm² of leaf area in barley and 15.5 in rice. That number has no units, because it is area divided by area: it says the inside surface is about twenty times the outside. Do not mix it with the cube’s ratio in per um.
Branching. The airways of the mammalian lung divide again and again, about 23 times in the standard textbook model of the adult human, from the trachea to the smallest airways. In a typical eudicot leaf, vascular tissue branches from the midrib into finer and finer veins, and the xylem in them brings water and minerals to the leaf. Branching shortens the last distance that diffusion has to cover.
Bulk flow. Bulk flow moves a whole fluid, and everything in it, by a pressure difference or by motors. Breathing, blood circulation and the movement of sap in phloem are all bulk flow; you will meet them in gas exchange, circulation and plant transport. It even happens inside single cells. In the giant cells of the alga Chara, motors drive the cytoplasm round at up to about 100 um per s.
None of these removes diffusion. In the mammalian lung, transport shifts from bulk airflow toward diffusion in the finest branches, and oxygen crosses the alveolar wall into the blood by diffusion, not by active transport. Bulk flow carries material most of the way; diffusion still does the last few micrometres.
These limits are conditional, not absolute. Volland and colleagues (2022) described a bacterium, Candidatus Thiomargarita magnifica, whose cells averaged more than 9,000 um long, which shows that shape and internal arrangement can push a single cell far beyond the usual size.
Body mass and metabolism: Rubner, Kleiber and the debate
Metabolic rate is the rate at which an organism uses energy. Basal metabolic rate is that rate in an adult endotherm, an animal that keeps itself warm with its own heat (mammals and birds), measured at rest, fasted, and at a temperature where it spends nothing extra on heating or cooling. Allometry is the study of how a trait changes with body size when it does not change in simple proportion.
In 1883 Max Rubner asked whether every gram costs the same. He studied resting dogs of different sizes and estimated each dog’s heat production. If cost were proportional to mass, a dog ten times heavier would make ten times the heat. It did not. Total heat rose less steeply than mass, and small dogs produced more heat per kilogram. Heat per unit of body surface came out roughly constant across his dogs, the “surface law”, with an exponent near 2/3. That ruled out simple proportionality in these dogs. It did not show that surface heat loss is the cause in other animals.
In 1932 Max Kleiber fitted resting rates for animals from rats to steers and found an exponent near 3/4. Both are written as a power law:
metabolic rate = a x M^b and rate per kg = a x M^(b - 1)
Here M is body mass, a is a constant for the group, and b is the exponent, the slope of log rate against log mass. If b is below 1, rate per kilogram falls as animals get bigger.
Worked problem, part 3. Use the widely quoted mammal fit, basal metabolic rate of about 70 x M^0.75 kilocalories per day with M in kilograms. It is an empirical fit, and the exponent is debated.
- 30 g mouse, M = 0.03 kg. 0.03^0.75 = 0.072, so rate = 70 x 0.072, about 5.0 kcal per day, or about 168 kcal per kg per day.
- 70 kg adult human. 70^0.75 = 24.2, so rate = 70 x 24.2, about 1,690 kcal per day, or about 24 kcal per kg per day.
- Compare. The human’s total is about 1,690 / 5.0, roughly 336 times the mouse’s, and the mouse’s rate per kilogram is about 168 / 24, roughly 7 times the human’s.
- Change b. With b = 2/3, the ratio of rates per kilogram becomes (70 / 0.03)^(1/3) = 2,333^(1/3), about 13. The exponent alone nearly doubles the predicted difference.
Treat 3/4 as a fit, not a law. White and Seymour (2003) found a mammalian exponent near 2/3 once body temperature and digestive state were controlled. Griebeler and Werner (2016), comparing ordinary and phylogenetic regression across 17 mammalian orders, found no single exponent for all the groups. The exponent depends on the group, the state (basal, field or maximal), temperature and method, and no explanation of it is settled. How metabolic rate connects to body temperature comes next, in thermoregulation.
In this sketch: one mammal fit, basal rate = a × Mb with a = 70 kcal per day and M in kg; a fitted line, not measurements; no data points. The line is drawn from 10 g to 1,000 kg only so you can move the markers; the lesson uses it for the 30 g mouse and the 70 kg adult human.
- Ratio of totals, heavier ÷ lighter
- –
- Ratio of rates per kg, lighter ÷ heavier
- –
3/4 is an empirical fit, not a law. White and Seymour (2003) found a mammalian exponent near 2/3 once body temperature and digestive state were controlled; Griebeler and Werner (2016) found no single exponent for all the groups. The exponent depends on the group, the state, temperature and method, no explanation of it is settled, and a fitted slope cannot confirm a mechanism.
Rule to keep: rate per kg = a × M(b − 1), so when b is below 1 the rate per kilogram falls as mass rises. The sketch is a fitted line, not a measurement of any animal. The lesson rounds along the way, so its figures are slightly rounder.
Design problem
You are given illustrative data. Plotting log basal metabolic rate against log body mass gives a slope of 0.70 for 40 rodent species and 0.68 for 40 bird species. Pooling those species with shrews and whales gives a slope of 0.76. A classmate says the pooled slope confirms that metabolic rate is set by the branching geometry of blood vessels, as one well-known network model (West, Brown and Enquist, 1997) proposes. What does each slope tell you, and what would you say to your classmate?
One way to do it
Each slope is an estimate of b for that set of animals. Within rodents, a 100-fold rise in mass predicts about 100^0.70, roughly 25 times the total rate; within birds, about 100^0.68, roughly 23 times. The pooled slope is a different quantity. Adding shrews and whales stretches the mass range, and if the groups differ in their constant a, the line through all of them can be steeper or shallower than the line within any one group. At 0.76, a 100-fold rise predicts about 33 times the rate.
Before trusting any of the three, ask how the rates were measured (basal, field or maximal), at what temperature, and with what regression. Related species are not independent points, so a phylogenetic regression may give a different slope from an ordinary one; see reading phylogenetic trees.
To your classmate: a slope near 3/4 is consistent with the network model, but it is also consistent with other explanations, and the within-group slopes here are nearer 2/3. A fitted number cannot confirm a mechanism. Testing one would need a prediction that rival explanations do not share, checked in data collected under the same conditions.
How we measure it
Respirometry and indirect calorimetry
Measure how fast an animal consumes oxygen (or produces carbon dioxide) while it rests in a chamber, then convert the gas exchange into a rate of energy use. Done under standard conditions (adult, at rest, fasted, thermoneutral), it gives a basal metabolic rate that can be compared across species.
Comparative regression on log-log axes, ordinary and phylogenetic
Plot the logarithm of metabolic rate against the logarithm of body mass for many species and fit a straight line; its slope is the exponent b. Ordinary least squares treats each species as independent, while phylogenetic regression allows for the fact that related species resemble each other, and the two can give different slopes.
X-ray microcomputed tomography of leaves
Scan a small leaf disc with X-rays from many angles and rebuild it as a three-dimensional image. From the image you can measure the internal air spaces and the area of mesophyll cell surface exposed to them, per unit of leaf area.
Finish line
Test yourself
8 questions
Practice and MCAT-style, with explained answers.
Next · Lesson 3
Microbes, Protists and Fungi
A methane-making microbe and E. coli look alike under a microscope. Their ribosomal RNA says they are about as far apart as either is from a yeast.
Continue →