Sensory Systems · Unit 7: Smell and taste
One Receptor per Neuron: How Olfactory Neurons Choose
A mature mouse olfactory neuron transcribes one odorant-receptor gene from one allele, out of about a thousand genes. This lesson follows the mouse evidence for how that choice is made (silenced chromatin, competing enhancer hubs, a stress-pathway feedback) and then compares an insect receptor channel with a human receptor structure. Afterwards you can read a dose-response shift from a pocket mutant and design a test of a structure-based ligand prediction.
Watch first One Receptor Gene, Chosen in Steps · 2:52
A mouse olfactory neuron holds about a thousand odorant-receptor genes in each of its two copies, yet a mature one transcribes a single copy of a single gene. How does a cell make a choice that complete, and keep it?
The core course states the rule and moves on: smell and taste covers the Buck and Axel cloning, one receptor and two glomeruli, and the combinatorial code. This lesson starts where that one stops, with the mechanism. First the definition, because it is easy to over-read. Singular choice means that in a mature mouse olfactory sensory neuron, one receptor gene is transcribed from one allele (Chess and colleagues, 1994; Monahan and colleagues, 2017). It does not mean one receptor molecule, one odour, or one stage of development: the newer mouse work below finds competing states on the way to that endpoint.
Silence first, then choose
Picture a library in which nearly every book is chained shut and one is left open. That is close to what Magklara and colleagues (2011) found. They sorted olfactory neurons from the epithelium of mice aged 6 to 10 weeks and used chromatin immunoprecipitation, which pulls down the DNA wrapped around histones that carry a chosen chemical mark. Receptor loci were enriched for two repressive marks of heterochromatin (tightly packed, silenced chromatin), H3K9me3 and H4K20me3. Their data suggested that this silencing comes before detectable receptor expression. In neurons labelled for the receptor P2, the active P2 allele carried less of the repressive marks than its inactive partner.
Read that carefully. The comparison shows that the chosen allele sits in a less repressed state. It does not say which change starts the choice, and it does not say the chosen gene silences the others: the silencing was already there. The picture in which feedback from the winning receptor does the silencing is not what these data show: the bulk of the silencing was already there. Feedback and receptor RNA act later, as the next sections describe.
A second line of evidence comes from the histone demethylase gene Lsd1 (see eukaryotic gene regulation). Lyons and colleagues (2013) deleted Lsd1 early in the mouse epithelium and read the RNA of the whole tissue at embryonic day 18.5. The control tissue yielded 662 detected receptor genes and the knockout 212, which is 212 / 662 = 0.32, about a third. The authors concluded that early Lsd1 deletion impaired initiation of receptor expression. This is dependence, not mechanism: it does not show that LSD1 itself removes H3K9me3 at receptor loci, and a count from bulk tissue depends on the assay and the cells in the sample.
Enhancer hubs that compete in trans
Silencing leaves the question of how one gene escapes. An enhancer is a DNA element that raises transcription of a gene it contacts. Markenscoff-Papadimitriou and colleagues (2014), working in adult mouse epithelium with 4C-seq (which maps contacts made by one chosen DNA site) and DNA FISH (which labels loci to see how near they sit), associated receptor transcription with contacts between candidate enhancers on different chromosomes. The chromatin-remodeling factor Bptf facilitated those contacts, and disrupting them was associated with weak expression of several receptors at once.
What assembles the contacts? Monahan and colleagues (2017) found that the factors Lhx2 and Ebf bind cooperatively at enhancer motifs with a stereotyped spacing. In their ChIP-seq of sorted mature neurons, the receptor-cluster analysis found 63 peaks bound by both factors, 2 by Ebf alone and 51 by Lhx2 alone. So 63 of the 65 Ebf peaks, 97 percent, were also bound by Lhx2, while 63 of 114 Lhx2 peaks, 55 percent, were bound by Ebf. An array of enhancer elements inserted into the mouse genome raised the frequency with which linked receptors were chosen, which is a sufficiency-style test of the idea.
Monahan, Horta and Lomvardas (2019) used in situ Hi-C, which captures DNA segments that were close together in the nucleus and counts the pairs. In sorted mouse neurons and their progenitors, receptor clusters on 18 chromosomes made contacts with one another, and LHX2 and LDB1 regulated assembly and maintenance of these compartments and hubs. A caution applies: a population contact map averages over many cells and cannot show that each cell has a single hub.
Pourmorady and colleagues (2024) went to single cells. Combining single-cell multiomes (RNA plus chromatin accessibility) of 5- and 12-week-old mouse olfactory epithelium with single-cell Hi-C (Dip-C) on sorted mouse neurons, they inferred several competing hubs in developing neurons before one gene became dominant. Their evidence supported two further steps: receptor RNA suppressed the transcription of competing receptors at a distance, and translation of the receptor then stabilized transcription at the prevailing hub. The machinery that carries out the long-range suppression is still unidentified. A 2025 mouse study (Duffié and colleagues) added a Mex3a-dependent step that acts after transcription, and its conditional deletion caused premature ER stress during the stage when several receptors are transcribed. Singular expression is therefore the endpoint of a sequence, not a property of every stage.
Feedback through a stress pathway
Once a receptor is expressed, something must prevent a second choice. The evidence is again from mice. In neurons lacking the cyclase Adcy3, lineage tracing of one receptor, MOR28, at postnatal day 2 showed about a twofold higher ratio of singly to doubly marked neurons, which supports more switching, at an age when most neurons are still immature (Lyons and colleagues, 2013). Lineage tracing here means a recombinase permanently marks any neuron that has ever activated a given receptor locus, so a marked neuron that now expresses a different receptor has switched. The authors also reported that Adcy3 participates in downregulating Lsd1 after choice, so the cyclase that serves transduction in the cilia (senses and cGMP) also stabilizes the choice.
How does the neuron know a receptor has been made? Dalton, Lyons and Lomvardas (2013) found that receptor expression engages the unfolded protein response, the pathway by which a cell reacts to misfolded protein in its endoplasmic reticulum (stress signals). In developing mouse neurons, PERK-dependent phosphorylation of eIF2α promoted selective translation of ATF5, and ATF5 promoted transcription of Adcy3. Adcy3 induction in turn relieves the stress response, which supports a two-step model. These are epistasis experiments in mice, including newborn eIF2α-mutant animals rescued with ATF5. They place the signals in order, but they do not show that every receptor contacts PERK directly.
Receptor identity also reaches the wiring. The 1996 receptor-swap experiments (Mombaerts and colleagues, mice) suggested an instructive but nonexclusive role for receptor identity in axon targeting. Imai and colleagues (2006) reported that receptor-derived cAMP signals shift expression of guidance molecules and bulb projection sites along the anterior-posterior axis, and Serizawa and colleagues (2006) found that Kirrel2, Kirrel3, ephrin-A5 and EphA5 vary with receptor activity. Shayya and colleagues (2022) reported that different receptor sequences produce different ER-stress patterns in developing mouse neurons, and that Ddit3 links PERK signalling to guidance and adhesion genes. The map-building rules are in partners, layers and self-avoidance and topographic maps; here the point is that the choice and the address can share a signal.
Two receptor architectures, and predicting ligands
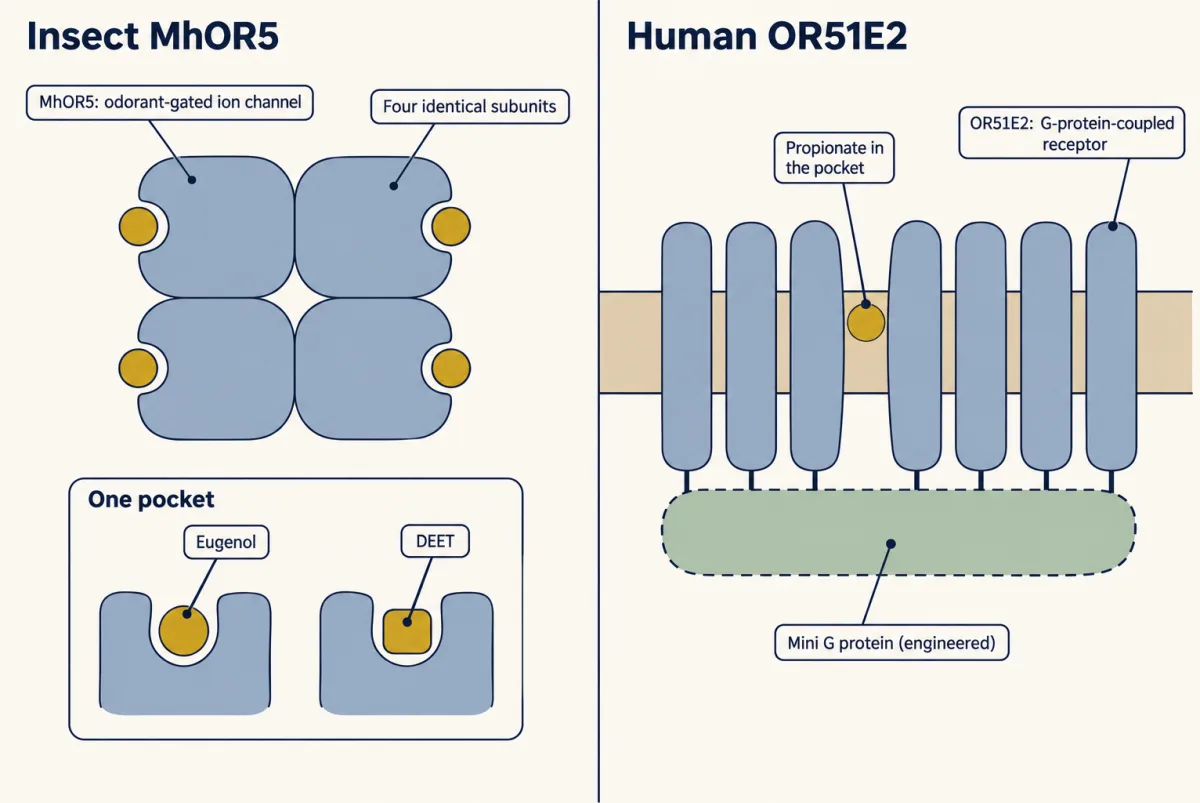
Now the protein. Del Mármol, Yedlin and Ruta (2021) solved cryo-EM structures of the bristletail receptor MhOR5, expressed in human cultured cells: a homotetramer (four identical subunits) that is itself an odorant-gated ion channel, with eugenol and the repellent DEET bound in one pocket. In a calcium-imaging screen it responded to more than 65 percent of the odorants in a 54-molecule panel. This is an insect channel, not a G-protein-coupled receptor.
Mammals use the other design. Billesbølle and colleagues (2023) solved active human OR51E2 bound to propionate at 3.1 angstroms, as a purified, engineered complex with a mini G protein, made in HEK293-derived Expi293F cells, with the cAMP assays done in HEK293T cells. The human genome encodes about 400 odorant GPCRs; that is the human repertoire, not the mouse count, and not the 511 clones of a human screening library (Mainland and colleagues, 2015). The pocket mutants F155A and L158A gained responses to longer-chain fatty acids in a cAMP assay. Consensus-sequence structures from 2024 (de March and colleagues) extend the coverage, but they are engineered sequences and must be labelled so.
Worked problem: reading a dose-response shift. In the cAMP assay, propionate gave an EC50 of 0.824 mM for wild-type OR51E2 and 12.3 mM for F155A. Assume a Hill slope of 1, zero baseline, and each construct normalized to its own maximum, so response R(c) = c / (EC50 + c). These are the mean EC50 values in Extended Data Table 2 of the paper; its Table 3 gives 1.40 mM and 9.13 mM for the same two constructs (a shift of about 6.5-fold), and the F155A pEC50 in Table 2 has a standard error of 0.77 log units, so the size of the shift is uncertain. These are model values, not measured light outputs.
R(c) = c / (EC50 + c)
Step 1: both at 0.824 mM. Wild type: R = 0.824 / (0.824 + 0.824) = 0.500. F155A: R = 0.824 / (12.3 + 0.824) = 0.824 / 13.124 = 0.063.
Step 2: the potency shift. 12.3 / 0.824 = 14.9, a rightward shift of about 15-fold.
Step 3: both at 12.3 mM. Wild type: R = 12.3 / 13.124 = 0.937. F155A: R = 12.3 / 24.6 = 0.500.
Step 4: check. For wild type to give R = 0.063, c = EC50 × R / (1 − R) = 0.824 × 0.063 / 0.937 = 0.055 mM, and 0.824 / 0.055 = 15, matching the shift. Two cautions: these are functional EC50 values, not binding constants, and they say nothing about the airborne concentration a human nose detects.
- R at c, wild type
- 0.500
- R at c, F155A
- 0.063
- c for target R, wild type
- 0.824 mM
- c for target R, F155A
- 12.3 mM
- Ratio of the two concentrations
- 14.9-fold
In this sketch: Hill slope 1, zero baseline, each construct normalized to its own maximum, a cAMP assay in cultured cells (Billesbølle and colleagues, 2023); model values, not measured light outputs.
This sketch cannot say: that an EC50 is a binding constant; what airborne concentration a nose detects; whether concentrations this high (the axis runs to 1000 mM) could be tested, since values far above the lesson’s are model arithmetic only; whether the two maxima were equal (each curve is scaled to its own, so a drop in maximum cannot be read here); or that the mutant’s gain for longer-chain fatty acids follows from this curve.
Rule to keep: with a Hill slope of 1, R = c / (EC50 + c), so the concentration that gives any chosen response is EC50 × R / (1 − R), and the shift between two constructs equals the ratio of their EC50 values at every response. Even so, the size of the shift is uncertain.
Design problem
A structure predicts that widening one pocket residue should let a receptor respond to a longer-chain ligand. Design the test, and say what a non-response would and would not mean.
One way to do it
Make the point mutant and confirm that it reaches the cell surface, since a protein that never arrives cannot respond. Compare it with wild type in the same assay, with empty-vector and mock-transfected controls, so that background and the host cell’s own cAMP signalling are accounted for. Run full dose-response curves instead of one concentration, and report EC50 and maximum response separately: a shift in EC50 and a drop in maximum mean different things. Include a ligand the wild type already responds to as a positive control for the mutant’s coupling.
A non-response in this assay would not show that the ligand cannot bind. A flat curve can mean no binding, no G-protein coupling, no trafficking to the surface, or an assay ceiling, so a negative in vitro is not a deorphanization. It would also not show what the receptor does in a neuron. If the mutant does respond, the next question is whether it does so in an olfactory neuron, where chaperones, cilia and the feedback pathway above are present.
How we measure it
ChIP-seq and in situ Hi-C
Chromatin immunoprecipitation pulls down DNA bound to a chosen histone mark or transcription factor, and sequencing says where it sat. In situ Hi-C ligates DNA segments that were close together in the nucleus and counts the pairs, giving a genome-wide contact map. Applied to sorted mouse olfactory cells, they show where repressive marks and factors sit and which receptor gene clusters touch.
Conditional genetics and lineage tracing
A gene is deleted in a chosen cell population at a chosen time, or a recombinase permanently marks every neuron that ever activated a given receptor locus. Comparing the mark with the receptor a neuron expresses now reveals whether it switched. Each result holds for that deletion, age and assay.
Single-cell chromatin contact and expression assays
Single-nucleus assays read, in one cell, which receptor genes are transcribed and which regions are accessible or in contact. They let the population averages of Hi-C be broken down into cells at different stages, including cells that have not yet settled on one receptor.
Cryo-EM with mutagenesis and a cAMP assay
A purified receptor is frozen and imaged to give a three-dimensional map, a pocket residue is changed, and a luciferase reporter of cAMP in cultured cells reports whether the response to a ligand shifts. Structure suggests a prediction and the assay tests it, in cells and not in neurons.
Finish line
Test yourself
8 questions
Practice and MCAT-style, with explained answers.
Next · Lesson 27
From Glomeruli to Piriform Cortex
Two mitral cells share one glomerulus and fire at the same average rate, yet disagree about when. What does the cortex do with that disagreement?
Continue →← Lesson 25 · Balance: Vestibular Hair Cells and Self-Motion