Biology · Unit 5: Classifying life
Building a Tree of Life
How do scientists figure out who is related to whom, when a whale looks more like a fish than like a hippo? You will score traits in a small group of animals, build a cladogram one shared trait at a time, and weigh fossil, embryo and DNA evidence. Afterwards you can read a tree, find the common ancestor of any two tips, and defend where an organism belongs.
Where this lesson sits
- Virginia SOL BIO.6a
- Virginia SOL BIO.6b
- Virginia SOL BIO.6c
- Practices BIO.1c, BIO.1d, BIO.1e, BIO.1f
Essential question: How do scientists figure out who is related to whom?
-
Life Science (grade 7) LS.3 c and LS.11 b
Review it at grade 7 level
In Life Science you sorted organisms into domains and kingdoms by whether their cells have a nucleus, which cell parts they have, how many cells they have, and how they get energy. You learned that DNA sequences can be compared to see how alike two organisms are. You also learned that fossils, DNA and similar body structures are evidence that organisms share common ancestors. Biology adds the cladogram, a branching diagram built from shared traits, and shows how fossil, embryo and DNA evidence are combined to decide who is related to whom.
-
Biology BIO.6a, BIO.6b, BIO.6c You are here
This lesson
-
Biology II Biology II: Advanced Survey of Biology Topics, BIOII.5 e and BIOII.7 b; Genetics, GEN.2 e
Preview where it goes next
This lesson built a tree from five traits scored present or absent. In Biology II you build cladograms from DNA, protein and body-structure data together and use them to think about how new species form. You compare homologous structures with analogous ones, which look alike because they do similar jobs but came from different ancestors, like a bird wing and an insect wing, and with vestigial structures that remain in reduced form. In the Genetics course you study the genetic code in detail and see why a code shared by almost all life is strong evidence of common ancestry.
-
College
Watch first Relatives Are Found By Inherited Traits · 2:32
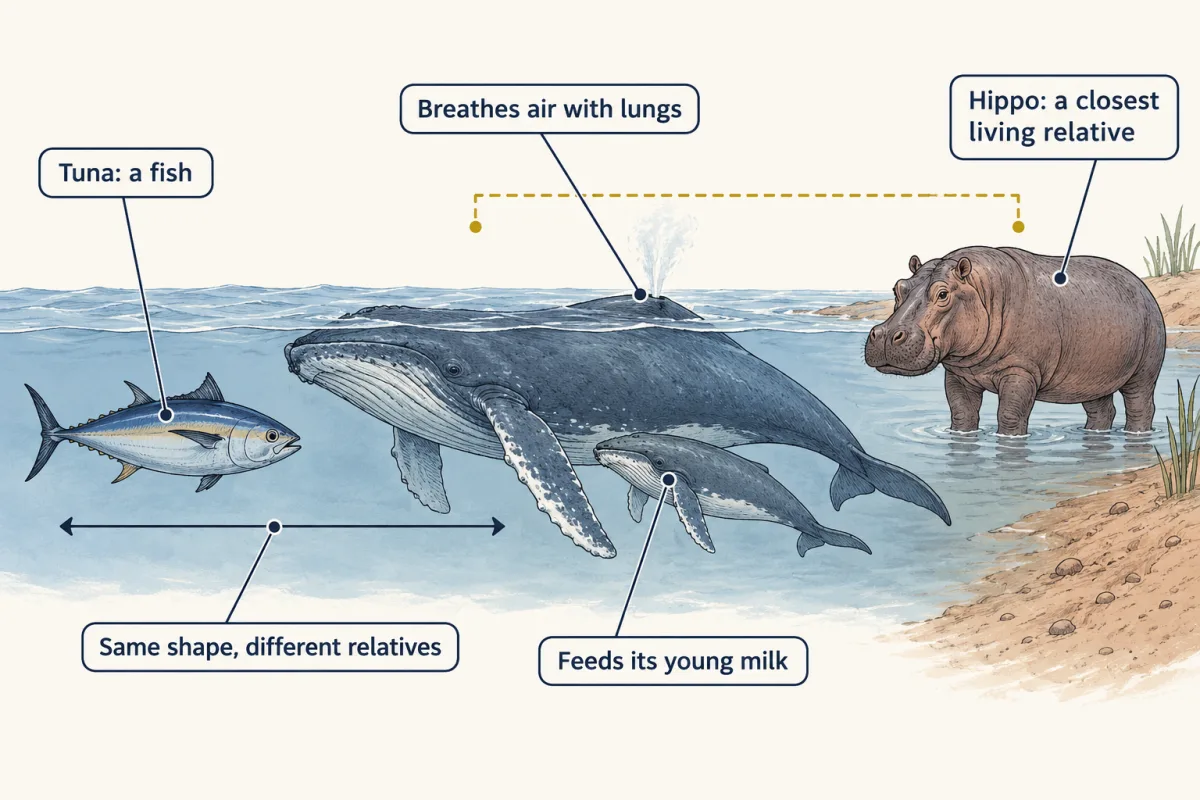
A whale swims in the sea and its body is shaped like a fish’s. Yet it breathes air with lungs, it feeds its young milk, and its closest living relatives are hippos.
At first glance, a whale and a tuna seem to belong together. A hippo spends its days in rivers and walks on four legs. So how did biologists decide that whales and hippos are cousins? Fossil whales with legs, whale embryos and whale DNA each tell part of the story.
What do you think? Decide before you read.
-
Scientists disagree: Looks, homes and diets can match in organisms that are not closely related. A shark and a dolphin are both sleek swimmers. Biologists instead compare inherited evidence: body structures built from the same parts, embryos, fossils and DNA. When these lines of evidence agree, the grouping is trusted more.
What scientists think
Scientists disagree: Looks, homes and diets can match in organisms that are not closely related. A shark and a dolphin are both sleek swimmers. Biologists instead compare inherited evidence: body structures built from the same parts, embryos, fossils and DNA. When these lines of evidence agree, the grouping is trusted more.
-
Scientists disagree: A cladogram is a branching diagram, like a family tree of cousins. Every tip is a living group that has been evolving for the same amount of time. You can spin the branches around a branch point, and the tree still means the same thing, so no tip is the top.
What scientists think
Scientists disagree: A cladogram is a branching diagram, like a family tree of cousins. Every tip is a living group that has been evolving for the same amount of time. You can spin the branches around a branch point, and the tree still means the same thing, so no tip is the top.
-
Scientists disagree: Fossils and DNA show that humans and chimpanzees share a common ancestor that lived long ago. Since that ancestor, both lines have kept changing. Living chimpanzees are our close cousins, not our grandparents.
What scientists think
Scientists disagree: Fossils and DNA show that humans and chimpanzees share a common ancestor that lived long ago. Since that ancestor, both lines have kept changing. Living chimpanzees are our close cousins, not our grandparents.
Explore: build a tree one trait at a time
In the simulation you start with six animals and a list of traits. You choose a trait, such as a backbone, and the animals that lack it branch off the tree first. Each trait you add splits the group again, until you have a full cladogram. A DNA panel then lets you check your tree against a different kind of evidence.
DNA differences here are made-up numbers in relative units, in this sketch. For a real scale, the lesson reports 1.23 mismatches per 100 aligned bases between one chimpanzee and human DNA (2005), about 12 per 1,000. Rule used in this sketch: the earlier two animals split, the bigger the number (10 per step).
Assumptions in this sketch: trait scores come from the lesson’s teaching table (1 present, 0 absent). Lancelet is the outgroup, the animal everyone else is compared to. Branch lengths mean nothing. Before every trait is in, a branch point can have more than two branches (not yet split).
Rule to keep: animals that share a derived trait stay together, each branch point stands for a common ancestor, and spinning branches around a branch point does not change the tree. This is a sketch of the logic.
Try this.
- Predict which animal will branch off first when you add “backbone”. Then add it and check.
- Add the traits in a different order. Predict whether the finished tree will change, then test it.
- Spin two branches around their branch point. Does the tree now say something different about who is related to whom?
- Open the DNA panel. Predict whether the DNA evidence will agree with the tree you built from body traits.
Explain: the evidence for shared ancestry
- classification
- homologous structures
- embryology
- fossil record
- common ancestor
- genetic code
- cladogram
- shared derived characteristic
- branch point
Classification is the grouping of organisms by how they are related. Biologists use several kinds of evidence, and they trust a grouping most when the kinds agree.
Homologous structures are body parts built from the same set of parts because they were inherited from a common ancestor. A common ancestor is an earlier population that two or more groups descended from. Look at the forelimb of a human, a bat and a whale. A hand grasps, a wing flies and a flipper steers, yet all three have one upper arm bone, two forearm bones, wrist bones and finger bones.
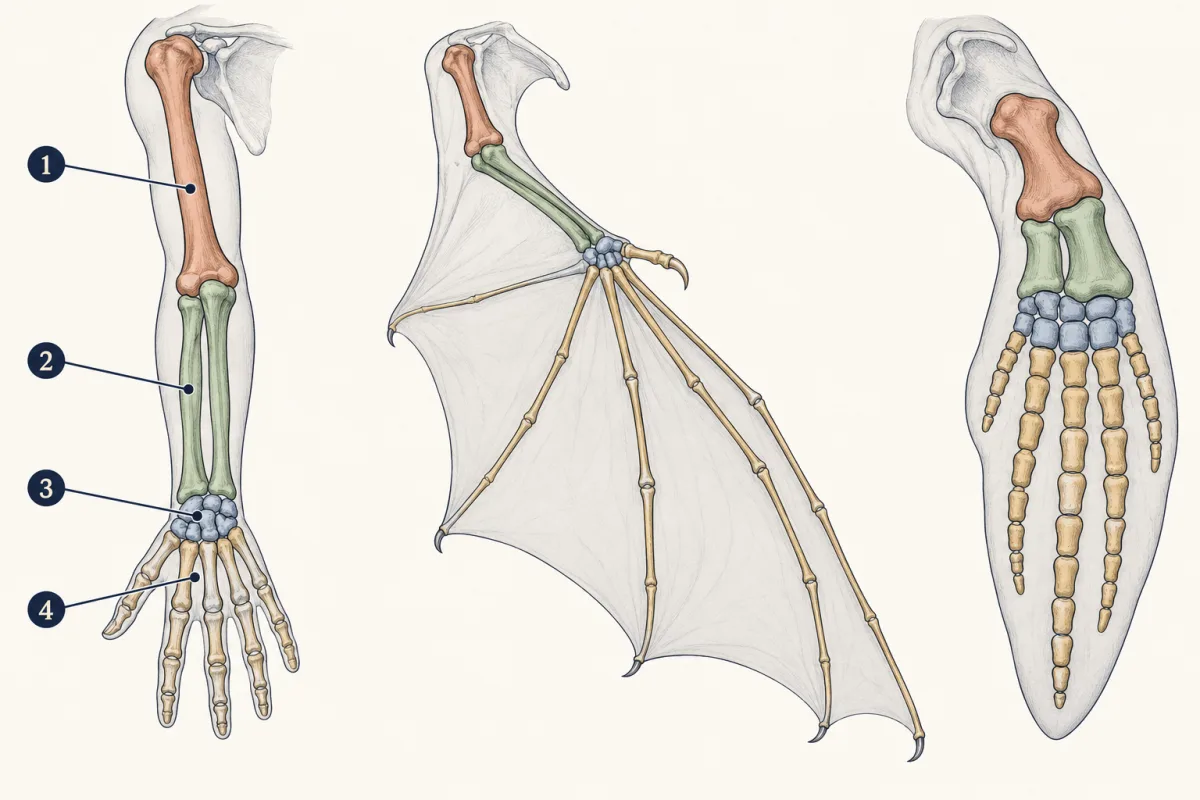
- upper arm bone
- two forearm bones
- wrist bones
- finger bones
- upper arm bone
- blank
- blank
- finger bones
Word bank: two forearm bones, wrist bones
- blank
- blank
- blank
- blank
Check your labels
- upper arm bone
- two forearm bones
- wrist bones
- finger bones
Embryology is the study of how organisms develop before birth or hatching. Embryos can share parts that the adults lose. Early fish, chick and human embryos all have a tail and a row of folds in the neck called pharyngeal arches, with slits between them sometimes called “gill slits”. In fish, several of these arches go on to support gills. In humans they become parts of the jaw, ear and throat, and the tail shrinks away. Human embryos do not turn into fish first. They share early parts with other vertebrates, then follow their own path. Some old textbook drawings made embryos look more alike than they really are, so biologists now compare photographs of real embryos.
The fossil record is the collection of preserved remains and traces of past life, placed in time order by the rock layers they are found in. Fossils show what bodies looked like long ago, including groups that no longer exist.
DNA and proteins give a fourth line of evidence. The more two species’ sequences match, the more recently they usually shared an ancestor. Deeper still, almost every organism reads its DNA with the same genetic code, the rule that matches each three-letter DNA “word” to an amino acid. The code has a few small exceptions. Most organisms also share the same basic chemical reactions for breaking down sugar. A shared code and shared chemistry are best explained by common ancestry. You can read how the code works in that lesson.
Classification is also a nested list, from broad to specific: domain, kingdom, phylum, class, order, family, genus, species. Each level holds fewer organisms that share more traits. That lesson covers the top levels.
Explain: reading and building a cladogram
A cladogram is a branching diagram that shows the order in which groups split from common ancestors. It is built from a shared derived characteristic, a trait that first appeared in one ancestor and was passed to its descendants. Hair is one: mammals share it, and fish and frogs do not. A trait that every animal in your sample has, such as a backbone in a group of vertebrates, cannot split that group.
A branch point, or node, is where one line splits into two. Each branch point stands for the common ancestor of everything above it. To decide who is most closely related, trace the branches from two tips back to the branch point where they meet. The pair that meets at the most recent branch point is the closest.
Three rules keep you from misreading a tree:
- It branches; it is not a ladder. No tip is the goal, and a tip at the right edge is not “more advanced”.
- Tips side by side are not always closest. You can spin branches around a branch point and the meaning stays the same. Always trace back to the shared branch point.
- Line length depends on the tree. On a plain cladogram, lengths mean nothing. Some trees scale length to the amount of change, and some to millions of years. Read the key before you read lengths.
An analogy: a cladogram is like a family tree that shows only cousins and their shared grandparents. The analogy breaks because the “grandparents” at the branch points are whole populations that lived long ago, not single people, and none of them is alive today.
Elaborate: score six animals and place a whale
This table scores five traits in six animals, using 1 for present and 0 for absent. The lancelet, a small fishlike animal with no backbone, is the outgroup: the animal you compare everyone else to.
| Animal | Backbone (1/0) | Jaws (1/0) | Four walking legs (1/0) | Amnion (1/0) | Hair (1/0) |
|---|---|---|---|---|---|
| Lancelet (outgroup) | 0 | 0 | 0 | 0 | 0 |
| Lamprey | 1 | 0 | 0 | 0 | 0 |
| Tuna | 1 | 1 | 0 | 0 | 0 |
| Salamander | 1 | 1 | 1 | 0 | 0 |
| Turtle | 1 | 1 | 1 | 1 | 0 |
| Leopard | 1 | 1 | 1 | 1 | 1 |
These scores are a teaching dataset from a published biology textbook figure (copyright 2005), shown in City Tech (CUNY) course slides for BIO1201 (spring 2019 course website). They are not measurements of individual specimens. The source calls one trait the “amniotic (shelled) egg”. Here it means an embryo that grows inside a protective membrane called the amnion, which is why a leopard scores 1 even though it is born alive.
DNA gives a second check. In 2005 a team compared the genome of one chimpanzee, named Clint, with human DNA. Across about 2.4 billion bases that could be lined up, they found 1.23 mismatches per 100 bases, so about 98.8 percent matched. That figure covers only the aligned parts, not every difference between the two genomes.
- Which trait separates the lamprey from all the other vertebrates? Which trait groups only the turtle and leopard?
- The backbone is scored 1 for five animals. Can it tell you whether the turtle is closer to the salamander or to the leopard? Why or why not?
- Using the chimpanzee numbers, about how many of every 1,000 aligned bases differ between humans and chimps?
Claim, evidence, reasoning
Make a claim about where a whale belongs on the tree of life, using evidence from fossils, embryos and DNA.
Start with: A whale belongs on the blank branch, and its closest living relatives are blank.
Start with: Whales breathe with blank and feed their young blank. Fossil whales such as blank had blank. Whale DNA shares blank with hippo DNA.
Start with: These traits were inherited from a common ancestor because blank, so the whale’s fishlike shape is blank.
Compare with a model answer
A whale belongs on the mammal branch, and its closest living relatives are hippos. Whales breathe with lungs and feed their young milk, traits that mark mammals, not fish. The fossil whale Maiacetus, about 47.5 million years old, had four limbs with hands and feet, and dolphin embryos briefly grow hind-limb buds that stop growing around week five. A 1999 study found DNA insertions shared by whales and hippos. The fishlike body is a later change that fits life in water. One limit is that the six-animal table here has no whale and cannot place it by itself.
Saved in this browser only.
Design problem
Plan a study to test whether whales are closer to hippos or to pigs, using inserted pieces of DNA. Say what you would measure and what result would support each answer.
One way to do it
- What you measure: at many matching DNA spots, whether an inserted piece of DNA is present or absent in whales, hippos, pigs, cows and an outgroup such as a horse.
- Prediction if whales and hippos are closest: several insertions found in whales and hippos but not in pigs.
- Prediction if hippos and pigs are closest: several insertions shared by hippos and pigs but not by whales.
- Constants: look at the same DNA spots in every species, and use the same lab method for each sample.
- Checks: sequence each spot to confirm the insertion is really there. Test more than one individual of each species, and use many spots, not one, so that a single odd result cannot decide the answer.
- Ethics: use DNA from museum tissue, stranded animals or zoo samples, so no animal is harmed for the study.
Evaluate: check your thinking
A whale looks like a fish because both swim, but its lungs and milk put it among the mammals. Fossil whales with legs, embryos that start to grow hind limbs, and DNA insertions it shares with hippos all point the same way. A whale’s shape fits where it lives; its relatives are found by tracing shared inherited traits back to a common ancestor.
Science practices you used: reading a data table of scored traits, building a model of relationships and naming its limits, using several lines of evidence to support a claim, and planning a test that could prove a claim wrong.
How we measure it
Scoring characters in a matrix
Each organism is checked for the same list of traits, and each trait is scored 1 for present or 0 for absent. The finished table shows which groups share which traits, so a tree can be built from it.
DNA insertion analysis
Scientists look at the same spot in the DNA of several species and record whether a piece of inserted DNA is there or not, then sequence the spot to confirm it. Species that share an insertion at the same spot most likely inherited it from one common ancestor.
Comparing embryos
Preserved embryos at different stages are examined and compared, sometimes with stains that show where a signal that guides how the embryo develops is active. Shared early structures can reveal relationships that adult bodies hide.
Finish line
Test yourself
8 questions
Practice and MCAT-style, with explained answers.
Next · Lesson 24
Domains and Kingdoms
One drop of pond water can hold organisms from all three domains of life. Which questions would you ask to tell them apart?
Continue →