Sensory Systems · Unit 5: Vision
Forty Kinds of Ganglion Cell
How many kinds of retinal ganglion cell does a mouse have, and what does it mean to count them? This lesson compares censuses made by calcium imaging, single-cell RNA sequencing, same-cell recording and electron microscopy, contrasts mouse with macaque, and looks at two specialised channels in detail. Afterwards you can say what each kind of measurement can and cannot decide about a cell type, and work out coverage and composition from published numbers.
Watch first A Count Depends On Its Method · 3:03
Four careful censuses of mouse retinal ganglion cells gave “at least 32”, “at least 35”, 42 and 46. Each was done well, and the numbers disagree. This lesson asks what each method was counting, and why the answer to “how many kinds?” depends on the question put to the cell.
The retina followed the signal from photoreceptor to ganglion cell and built ON and OFF centre-surround fields; sensory coding weighed labelled lines against population codes. Here we start at the output layer. Ganglion cell axons make the optic nerve, so every feature the brain receives has been computed by one of these cells, and the visual cortex can only work with what the channels deliver.
What makes a type a type, not a cluster
Three kinds of evidence can define a ganglion cell type. A functional type is a group of cells with the same light response. An anatomical type shares a dendritic shape and the depth in the inner plexiform layer (IPL, where bipolar, amacrine and ganglion cell processes meet) at which that shape sits. A molecular type shares an expression profile, and a cluster is the group an algorithm draws around such profiles. The usual standard for calling a group a type asks for agreement among them, plus a mosaic: cells of the type space themselves so that their dendritic territories tile the retina.
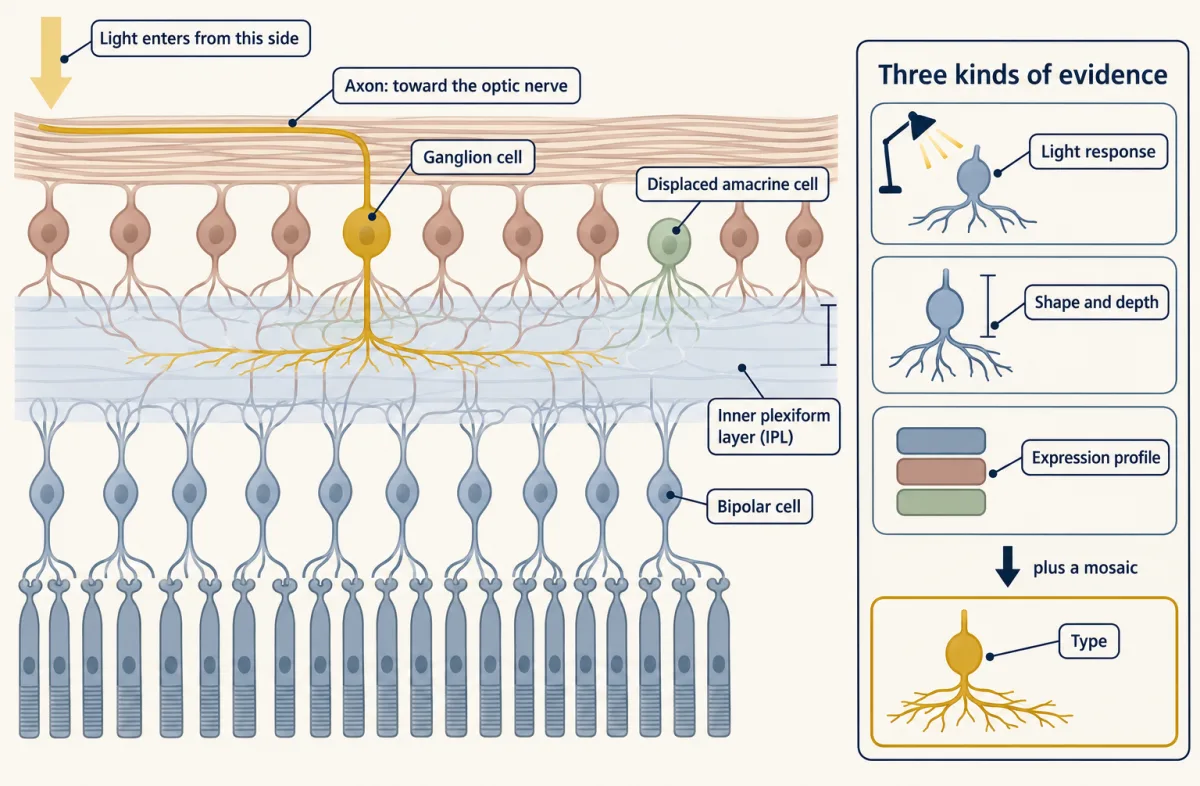
A cluster is separable expression, not yet a function. The sensory neuron atlas met the same problem in the dorsal root ganglion, and the answer is the same here. A transcriptomic or anatomical cluster becomes a type when response, shape and expression are tied to one another and, ideally, when genetic access lets you label or manipulate it.
Also keep in mind the coverage factor, the average number of dendritic arbors that cover a retinal location. It equals the density of cells times the area of one arbor.
coverage factor = cell density (cells/mm²) × mean dendritic field area (mm²)
Three censuses that disagree, and why
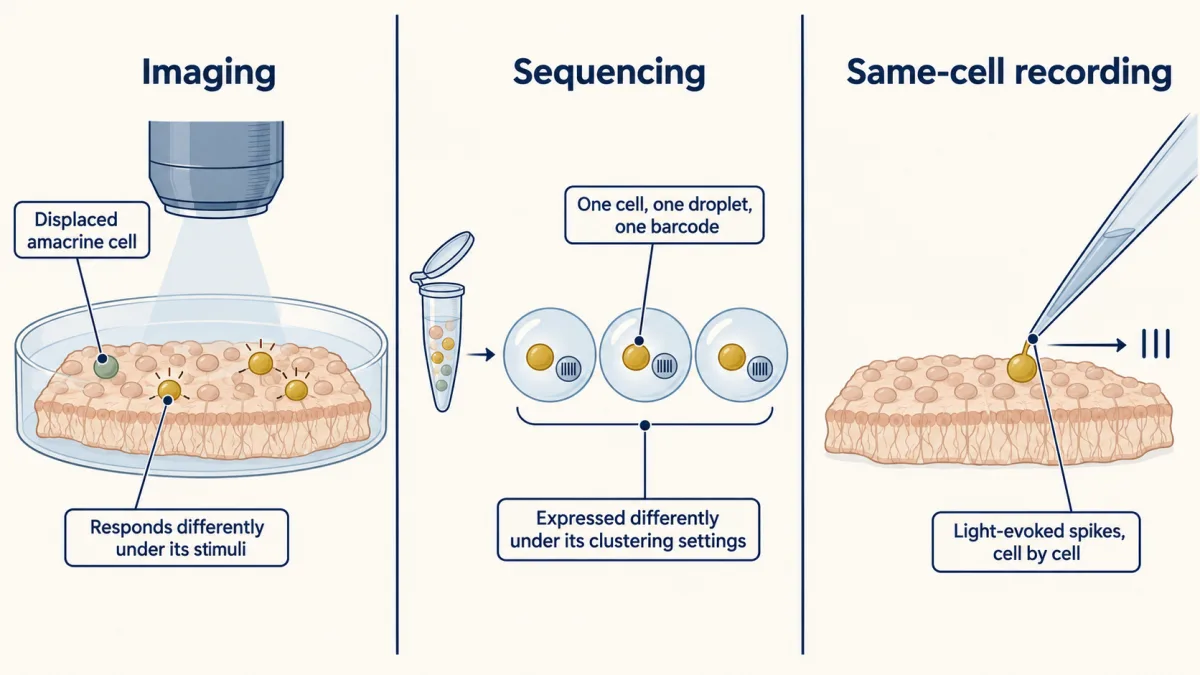
Imaging. Baden and colleagues (2016) used two-photon calcium imaging of the ganglion cell layer in isolated ventral retina from mice aged four to eight weeks. The data set held 11,210 cells, not 11,210 ganglion cells: the layer also holds displaced amacrine cells, and 14 groups of them were separated from the ganglion cell groups. The study distinguished a minimum of 32 functional types (four of the 32 groups came from clusters the authors labelled uncertain) and concluded that some unusually abundant types probably hide further subdivisions. The imaging was acquired at 7.8 Hz, so it follows a response profile, not individual spikes.
Sequencing. Tran and colleagues (2019) used droplet single-cell RNA sequencing, in which each dissociated cell is captured in its own droplet with a barcode. They profiled 35,699 high-quality ganglion cell transcriptomes from adult mice (postnatal day 56), flow-sorted from uninjured retina. There were 45 initial clusters, and subdividing one gave 46 types. Types ranged from 0.15% to 8.4% of the cells profiled, and most clusters needed a combination of two marker genes for a unique identity.
Worked problem, rare types. How many cells does a 0.15% type contribute? 0.0015 × 35,699 = 53.5, so about 54 cells. The largest type, 8.4%, gives 0.084 × 35,699 = 2,998.7, about 3,000 cells. The smallest type therefore rests on roughly fifty cells, and a different depth or clustering setting could merge it or split it.
Same-cell recording. Goetz and colleagues (2022) recorded light-evoked spikes in the cell-attached configuration from 1,859 ganglion cells in isolated mouse retina (4 to 12 weeks old), and sorted them into 42 functional types. In subsets they also collected the cell for RNA (a Patch-seq variant) or recovered its morphology. Their 42 types were estimated to cover 89% of the ganglion cell population. The same-cell alignment showed that the map between function and RNA is not always one to one: three sustained ON direction-selective types aligned with a single cluster, C10.
So the four numbers (at least 32, 42, 46, and the anatomical count below) are not rival answers to one question. Each reflects a method, a preparation and a resolution. Imaging sees what responds differently under its stimuli, sequencing sees what is expressed differently under its clustering settings, and the most trustworthy types are the ones that more than one method finds.
Counting by anatomy: dense reconstruction and the mosaic argument
Helmstaedter and colleagues (2013) used serial block-face electron microscopy, in which the face of a tissue block is imaged and shaved away repeatedly, with manual tracing and machine-learning segmentation, to reconstruct 950 neurons and their mutual contacts in the mouse IPL. The authors cautioned that not all contacts are synapses, so a contact map proposes partners and does not prove them. Yan and colleagues (2020) then sequenced 32,523 amacrine cells from mice at postnatal days 18 to 19 and reached 63 putative amacrine types, which they treated as a lower limit. Amacrine cells are among the partners of ganglion cells, so this repertoire is part of the circuit behind each channel.
Bae and colleagues (2018) paired anatomy with physiology. In one ex vivo mouse retinal patch (called e2198; the animal’s age was not recovered), they extracted calcium signals for 326 cells and kept 381 reconstructed ganglion cell arbors. These formed 47 anatomical clusters, and the union of internally validated clusters and securely known types set a lower bound of 35 types. Forty-seven is a count of clusters, and 35 is the number they could support. Within the patch, cells arborising in the inner margin of the IPL had on average more sustained responses.
Their density-conservation hypothesis says that the aggregate dendritic density of a type should be about uniform across the retina, even though cell density and arbor size vary across the retina. The coverage factor below is a related measure that counts arbors and not total dendrite, and either can serve as a quantitative check on a proposed type.
Worked problem, coverage. Zhang and colleagues (2012) reported, for the W3 type in mouse retina (a transgenic line in which W3 cells are fluorescent), a peak density of 440 cells/mm² in ventral retina and a mean dendritic field area of 10,300 ± 500 µm² (n = 25). Step 1: convert units. 10,300 µm² × 10⁻⁶ mm²/µm² = 0.0103 mm². Step 2: multiply. 440 cells/mm² × 0.0103 mm² = 4.53. About 4.5 arbors cover an average point. This does not by itself show that several types were mixed together: aggregate density can be conserved while individual arbors overlap. The figure also pairs a regional peak density with a mean area, so treat it as an estimate.
- Unit conversion
- 10,300 µm² × 10⁻⁶ = 0.0103 mm²
- Coverage factor, expected (density × area)
- 440 × 0.0103 = 4.53
- Mean count at the probe points, in this draw
- 4.5
- Cell bodies in the patch, in this draw (expected)
- 27 (27.5)
- Band from the spread
In this sketch: circular dendritic fields of equal size, uniform density inside the patch, cell positions on a jittered mosaic (the jitter amount is arbitrary) drawn at random (cells just outside the edge also cover points inside it), and a point counts as covered if it lies inside an arbor. The patch is 0.25 mm on a side and not to scale for any real field.
Coverage factor = cell density × mean dendritic field area, with µm² converted to mm² (× 10⁻⁶); it is an average number of arbors per location, so it is only as good as the density and area you put in.
Mouse is not macaque: regional composition in primate retina
Peng and colleagues (2019) profiled approximately 165,000 cells from the fovea and the periphery of adult male macaques (Macaca fascicularis, aged three to nine years), and found 16 foveal and 18 peripheral ganglion cell clusters. They checked the identities of the midget and parasol clusters with fluorescent in situ hybridization and viral labelling of cell shape. Midget clusters accounted for about 85% of sampled foveal ganglion cells and parasol clusters for 11%. When the group compared macaque and mouse, the two taxonomies diverged.
Worked problem, composition. In the foveal sample, midget plus parasol is 85% + 11% = 96%, leaving about 4% for every other cluster. In a made-up sample of 5,000 foveal cells that would be 0.04 × 5,000 = 200 cells. The 4% says how much of the sample is left over, not how many types share it.
Read this with its limits. The percentages are of sampled cells from the macaque fovea; they are not whole-retina figures and not human frequencies. A mouse retina has no fovea, and a mouse type cannot be renamed as a human type because the names look alike. A sensible way to say it: the mouse census is a map of a mouse, and a primate needs its own.
Two channels in detail: local change and an asymmetric arbor
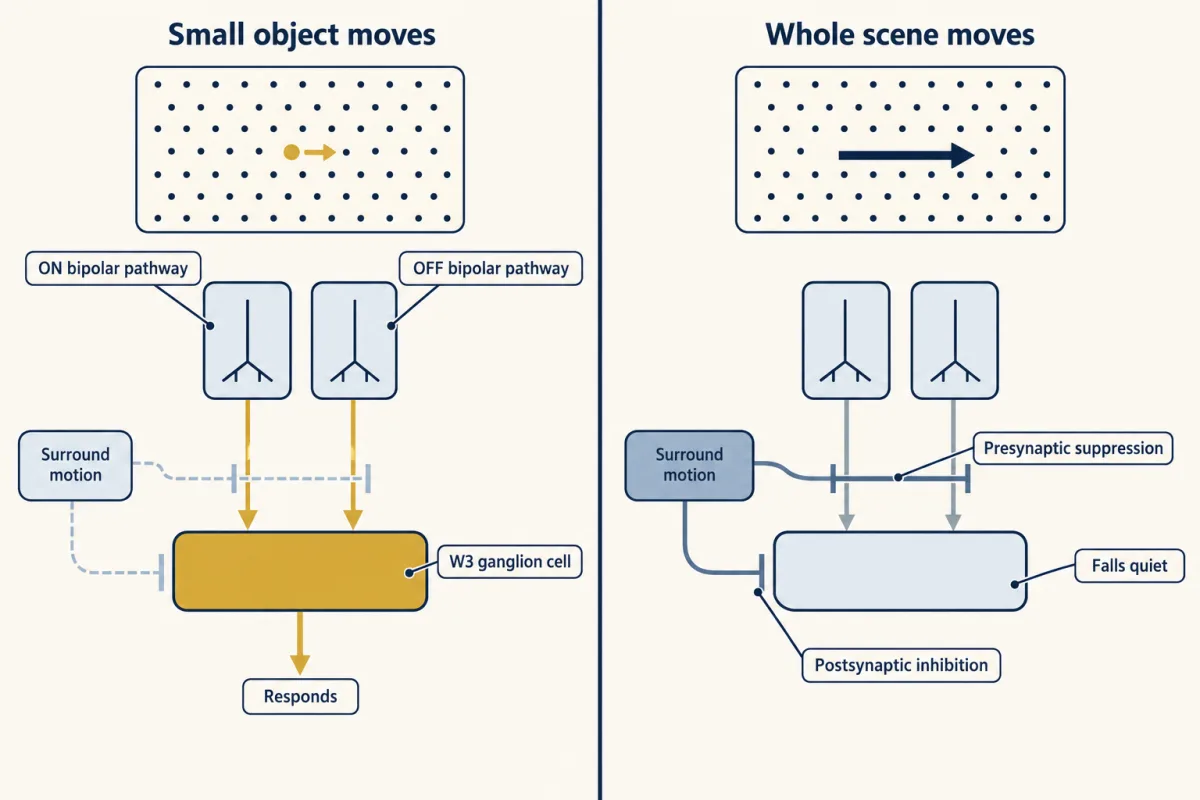
W3 cells. In the mouse line that makes W3 cells fluorescent, Zhang and colleagues recorded from isolated retina. A W3 cell pools rectified excitation from ON and OFF bipolar pathways, which means it is excited by local change of either sign. Motion in the distant surround recruits presynaptic suppression of that excitation and postsynaptic inhibition, so a W3 cell responds to a small object moving against a still background and falls quiet when the whole scene moves. Older recordings in isolated salamander and rabbit retina (Ölveczky, Baccus and Meister, 2003) had already found a subset of ganglion cells that preferred differential motion of centre and surround, and proposed wide-field amacrine cells as the source of suppression by global motion. Zhang’s group concluded that W3 corresponds to the rabbit local edge detector, which does not make every object-motion cell in every species a W3 cell. The authors proposed that W3 cells may act as alarm neurons for overhead predators. The experiments establish selectivity and circuit properties ex vivo; no behavioural test of necessity was done.
JAM-B cells. Kim and colleagues (2008) used a JAM-B-CreER mouse line to mark a class of OFF ganglion cells. CreER is a recombinase switched on by tamoxifen, so a reporter then labels cells that expressed the marker. A few hundred ganglion cells per retina were marked, at least 90% of them expressing JAM-B, so the line is enriched for the class and not perfectly pure. About 85% of the labelled cells had markedly asymmetric dendritic arbors, and in isolated retina the recorded cells preferred movement from soma toward dendrites. The same preference is described as upward motion in the visual field. Keep the frames apart: the lens inverts the image, so what is “up” in the world runs in the opposite sense across the retina, and a statement about the preferred direction needs its frame.
What a parallel-channel output means. The optic nerve is not a camera cable. It carries dozens of filtered versions of the scene, each assembled by a distinct circuit before any spike leaves the eye. W3 reports local change, JAM-B reports one direction, and others report contrast, colour or light level. A feature that no channel carries is gone before the brain has a chance. How the direction-selective circuits are built is the subject of the next lesson, non-image-forming channels appear in melanopsin cells, and photoreceptor adaptation and degeneration asks what changes when the input fails. Developmental lessons on spontaneous activity and topographic maps cover how the output layer is wired, and microscopy and images covers the reconstruction methods.
Design problem
In the Goetz data, three functionally distinct sustained ON direction-selective types mapped onto one transcriptomic cluster (C10). Does the retina have three types here, or one? Say what each measurement can decide, and propose an experiment.
One way to do it
Start with what each measurement is. A cluster is separable expression, and its number depends on sequencing depth and clustering settings. A functional type is a response plus a mosaic, so sharing one cluster does not make the three the same.
The data as given support three functional types that are not separated by RNA at this resolution. They do not yet say there are three types, and they do not say there is one.
A better experiment avoids comparing data sets. Record the light response of a cell, then recover its RNA and shape from that same cell. If the three response classes still share their expression, test whether each one has its own mosaic, with its own regular spacing and coverage. Ask for genetic access to one of the three, say a driver line that labels one class, so the class can be marked and manipulated. If a finer clustering later splits C10 into three along function, that supports three types. If cells of the three classes interleave in one mosaic, one type with several response modes is the better description.
None of this transfers to human retina: the data are from isolated mouse retina.
How we measure it
Two-photon calcium imaging of the ganglion cell layer
A fluorescent calcium indicator reports activity in many cells at once while light stimuli are shown to an isolated retina. Cells are then grouped by response, which gives a functional census but includes displaced amacrine cells that must be sorted out.
Droplet single-cell RNA sequencing
Each dissociated cell is captured in its own droplet with a barcode, so thousands of transcriptomes can be read and clustered. It separates cells by expression but does not by itself say what they compute.
Patch-seq
A cell's light response is recorded with a pipette, and the same cell is then collected for RNA sequencing, with morphology in some cases. The response and the transcriptome belong to one cell, so the response and the transcriptome need no matching to each other, though placing the cell in a reference atlas still does.
Serial block-face electron microscopy
A tissue block is imaged and a thin layer removed, over and over, giving a stack from which neurites can be traced. It gives exact shapes and contacts, but only for a small fixed piece of tissue.
Finish line
Test yourself
8 questions
Practice and MCAT-style, with explained answers.
Next · Lesson 19
Computing Motion in the Retina
A cell in the eye fires to a spot moving left and stays quiet for the same spot moving right. Which neuron makes the difference?
Continue →← Lesson 17 · Sensing the Gut: Enteroendocrine Cells and Nutrient Signals