Life Science · Unit 7: Heredity
Predicting Traits with Punnett Squares
Can we predict what traits a young plant or animal will have? You cross pea plants in a simulation, build Punnett squares, and test them against Gregor Mendel’s real pea counts. Afterwards you can predict the chance of each genotype and phenotype for one trait, and explain why real counts come close to the prediction but not exactly.
Where this lesson sits
- Virginia SOL LS.10 c
- Practices LS.1 c, LS.1 d, LS.1 e
Essential question: Can we predict what traits a baby plant or animal will have?
-
Life Science (grade 7) LS.10 c You are here
This lesson
-
Biology
Preview it at high school level
In Biology you will use the words homozygous (two same alleles, like PP or pp) and heterozygous (two different alleles, like Pp). You will run a test cross. You cross a purple plant with a white pp plant to find out whether the purple plant is PP or Pp, a genotype you cannot see. You will also track two traits at once, such as seed shape and seed color. The two genes can sort into sex cells independently, so a 16-box Punnett square predicts a 9 : 3 : 3 : 1 ratio. Then you will test these predictions against more of Mendel’s real counts.
-
Biology II Biology II: Advanced Survey of Biology Topics, BIOII.4 c-f; Genetics, GEN.5 a
Preview where it goes next
Biology II drops the simple rules of this lesson. In the Advanced Survey of Biology Topics course, you meet heterozygotes that look in between their parents (incomplete dominance) or show both traits (codominance). You meet genes with more than two alleles, such as the ABO blood groups, genes linked on one chromosome, and sex-linked traits. You also meet traits shaped by many genes, and genes that mask other genes. The Genetics course adds the chi-square test, which asks whether the gap between real and predicted counts is bigger than chance usually gives.
-
College
Watch first A Punnett Square Predicts the Chances · 2:40
Suppose a gardener crosses two pea plants that both have purple flowers, and both are Pp. The seeds are predicted to grow into mostly purple plants, with about one in four blooming white.
Neither parent had white flowers. So where was the white hiding? And could the gardener have predicted “one in four” before planting a single seed?
What do you think? Decide before you read.
-
Scientists disagree: Mendel crossed pea plants and counted thousands of offspring. He found no in-between forms. A trait that vanished in one generation came back unchanged in the next. A blend could not come apart again like that, so traits must pass on as separate units.
What scientists think
Scientists disagree: Mendel crossed pea plants and counted thousands of offspring. He found no in-between forms. A trait that vanished in one generation came back unchanged in the next. A blend could not come apart again like that, so traits must pass on as separate units.
-
Scientists disagree: Mendel recorded one pea plant with 43 round seeds and only 2 wrinkled ones, far from 1 in 4. When he added up thousands of seeds from many plants, the count came much closer to the prediction.
What scientists think
Scientists disagree: Mendel recorded one pea plant with 43 round seeds and only 2 wrinkled ones, far from 1 in 4. When he added up thousands of seeds from many plants, the count came much closer to the prediction.
-
Scientists disagree: In Mendel’s crosses, hidden traits came back unchanged in later generations, so the allele was still there. The word recessive only tells you whether a trait shows when a dominant allele is also present. It does not mean the allele is gone.
What scientists think
Scientists disagree: In Mendel’s crosses, hidden traits came back unchanged in later generations, so the allele was still there. The word recessive only tells you whether a trait shows when a dominant allele is also present. It does not mean the allele is gone.
Explore: breed purple and white pea plants
In the simulation you choose the genotype of two parent pea plants: PP, Pp or pp. You see the filled Punnett square with its predictions, then grow 4, 40 or 1,000 offspring, each made by a random draw of one sex cell from each parent. A bar graph puts your real counts next to the predicted ones.
- Purple flowers
- White flowers
- White offspring in the last runs (up to 8)
- none yet
Pick two parents and a number of offspring. Then press Grow offspring.
In this sketch: one gene with complete dominance (P purple, p white), no weather, soil or lost seeds, and every cross gives offspring. A Pp parent passes on P or p with a 50 percent chance, as the lesson says. A PP or pp parent makes only one kind of sex cell, so it is written twice to keep the 4-box square. The plants are labelled shapes, not to scale. Nothing here is measured; the computer makes the random draws.
A Punnett square gives the chance for each offspring, not an exact count. Real counts land near its ratio but rarely match it exactly.
Try this.
- Cross two Pp plants. Predict how many of 4 offspring will be white. Grow them, then repeat three times.
- Now grow 40, then 1,000. Predict first: will the share of white plants move closer to one in four, or stay just as scattered?
- Cross a PP plant with a Pp plant. Both have purple flowers. Predict whether any offspring will be white, then test it.
Explain: alleles can hide but do not disappear
- allele
- dominant
- recessive
- genotype
- phenotype
- Punnett square
- probability
- ratio
A pea flower shows one color, but each body cell of the plant carries two copies of the flower-color gene. An allele is one version of a gene. A pea plant gets one allele of each gene from each parent.
Pea plants have a purple allele and a white allele for flower color. Scientists write them as letters: P for purple and p for white.
- A dominant allele shows its trait even when there is only one copy. It gets a capital letter.
- A recessive allele shows its trait only when both copies are recessive. It gets a small letter.
When a dominant allele is there, it masks the recessive one. Masked means hidden from view, not destroyed. The p allele is still there, and it can still be passed on.
Your genotype is the pair of alleles you carry, such as Pp. Your phenotype is the trait that shows, such as purple flowers.
| Genotype | Alleles | Phenotype |
|---|---|---|
| PP | two same alleles (homozygous) | purple |
| Pp | two different alleles (heterozygous) | purple |
| pp | two same alleles (homozygous) | white |
A purple plant could be PP or Pp, so its looks do not tell you its genotype.
Sex cells carry only one allele of each pair, as you saw in that lesson. A PP plant can only pass on P. A pp plant can only pass on p. A Pp plant passes on P or p, with a 50 percent chance for each.
Explain: a Punnett square shows the chances
A Punnett square is a grid that shows every way the sex cells of two parents can join. It is a model that predicts offspring.
Here is how to build one for two Pp parents.
- Write one parent’s sex cells, P and p, across the top.
- Write the other parent’s sex cells, P and p, down the side.
- In each box, put the letter from the top with the letter from the side.
| P | p | |
|---|---|---|
| P | PP | Pp |
| p | Pp | pp |
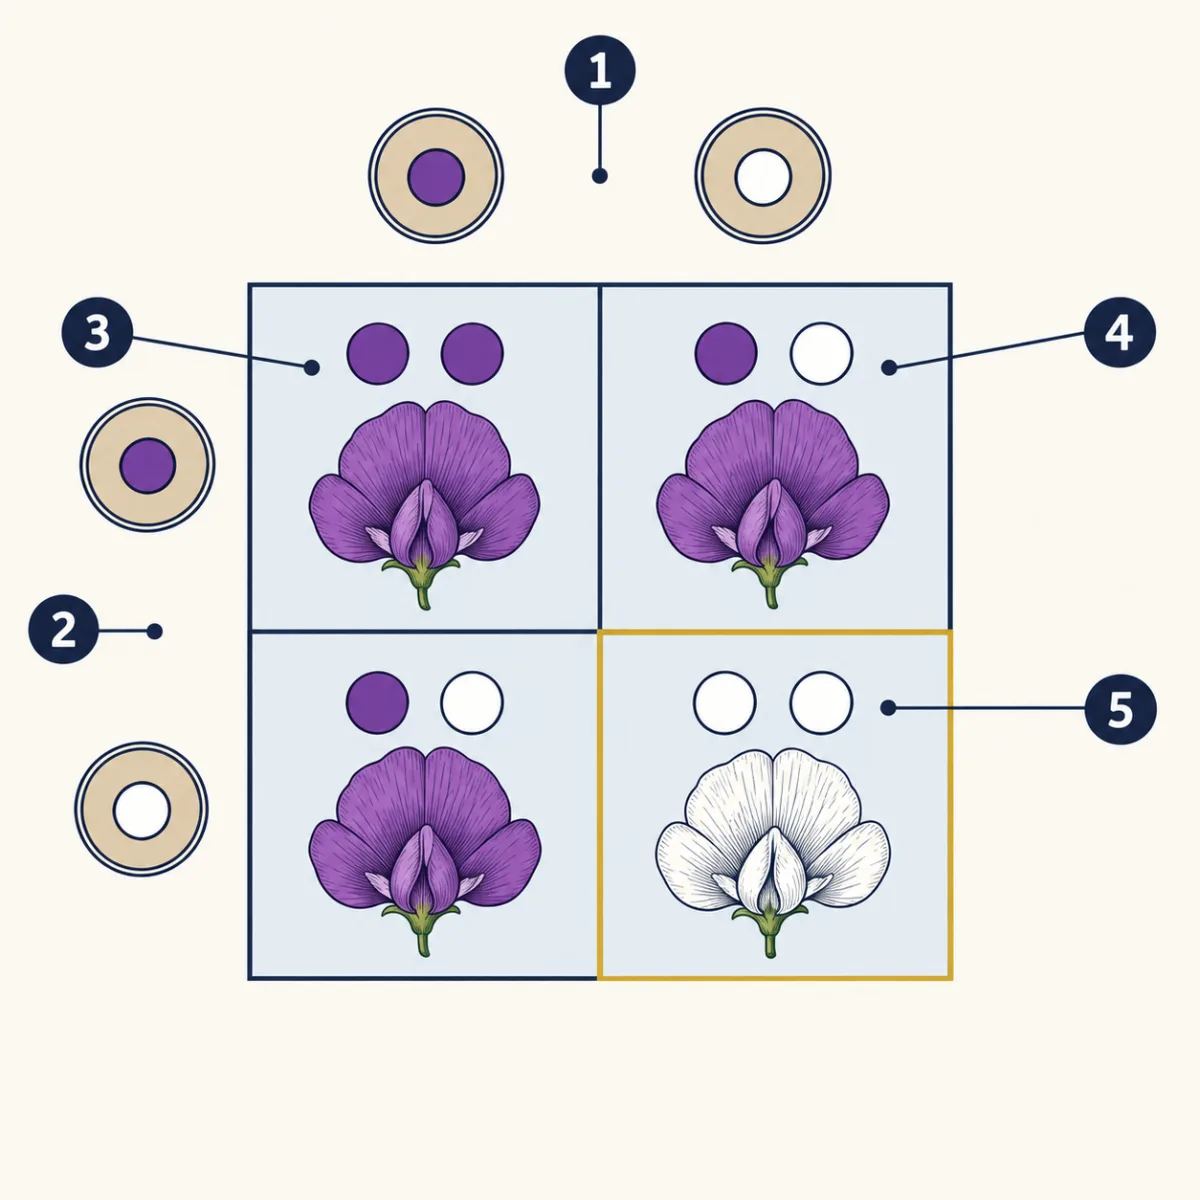
- one parent's sex cells (P and p)
- the other parent's sex cells (P and p)
- PP
- Pp
- pp
- one parent's sex cells (P and p)
- the other parent's sex cells (P and p)
- blank
- blank
- blank
Word bank: pp, Pp, PP
- blank
- blank
- blank
- blank
- blank
Check your labels
- one parent's sex cells (P and p)
- the other parent's sex cells (P and p)
- PP
- Pp
- pp
Probability is the chance that something will happen. Each box has the same chance, 1 in 4, because 1/2 × 1/2 = 1/4. A ratio compares two numbers, such as 3 purple to 1 white. You can write each prediction three ways.
| What you predict | As fractions | As percents | As a ratio |
|---|---|---|---|
| Genotypes | 1/4 PP, 2/4 Pp, 1/4 pp | 25, 50, 25 | 1 PP : 2 Pp : 1 pp |
| Phenotypes | 3/4 purple, 1/4 white | 75, 25 | 3 purple : 1 white |
Now the hidden white makes sense. Each parent is Pp. If both pass on p, the offspring is pp and blooms white. That has a 1 in 4 chance. This prediction needs both parents to be Pp. If one parent is PP, every offspring gets at least one P.
A Punnett square gives the chance for each offspring, not an exact count. Four seeds from two Pp parents might all bloom purple. The chance of that is about 32 percent. Mendel’s rules, and squares like this one, explain how many inherited traits are passed on. Later courses add other patterns.
- Two purple parents can have a white offspring when blank.
- The chance of a white offspring from two Pp parents is blank, or blank percent.
Elaborate: Mendel’s pea counts
Mendel crossed pea plants that differed in one trait. Their first offspring all showed the dominant trait. He let those hybrid plants fertilize themselves and counted the next generation.
| Trait (dominant vs recessive) | What was counted | Dominant (number) | Recessive (number) | Ratio (dominant ÷ recessive) |
|---|---|---|---|---|
| Seed shape: round vs wrinkled | seeds | 5,474 | 1,850 | 2.96 : 1 |
| Seed color: yellow vs green | seeds | 6,022 | 2,001 | ? |
| Flower color: purple vs white | plants | 705 | 224 | ? |
| Pod shape: full vs pinched | plants | 882 | 299 | 2.95 : 1 |
| Unripe pod color: green vs yellow | plants | 428 | 152 | 2.82 : 1 |
| Flower position: along the stem vs at the tip | plants | 651 | 207 | 3.14 : 1 |
| Stem length: tall vs short | plants | 787 | 277 | 2.84 : 1 |
Source: Gregor Mendel’s pea paper, read at two meetings in Brno in 1865 and printed in 1866 (English translation by Abbott and Fairbanks, 2016). The plants grew in his garden beds and in some pots. The paper does not give a year for each row. For flower color, Mendel sorted plants by seed-coat color, which goes with flower color. The ratios were calculated here.
- Find the two missing ratios. Divide the dominant count by the recessive count and round to two decimal places.
- Which row is farthest from 3 : 1? Which row has the fewest offspring counted? What do you notice?
- What percent of the flower-color plants were white? Divide 224 by the total, 929, and compare with 25 percent.
Claim, evidence, reasoning
Make a claim that answers the question: can a Punnett square predict the traits of pea offspring? Use Mendel’s counts.
Start with: Mendel’s counts show that a Punnett square blank.
Start with: For the seven traits, the ratios ranged from blank to blank. For flower color, blank of 929 plants were white, about blank percent.
Start with: The counts are close to 3 : 1 because blank. They are not exactly 3 : 1 because blank.
Compare with a model answer
A Punnett square predicts Mendel’s pea offspring well, but not exactly. For all seven traits, the ratio was between 2.82 : 1 and 3.15 : 1, close to the predicted 3 : 1. For flower color, 224 of 929 plants were white, about 24.1 percent, near the predicted 25 percent. The counts are close because each offspring had a 1 in 4 chance of getting two recessive alleles. They are not exact because each offspring is a separate chance. One limit is that all the data come from one scientist, one kind of plant and one garden.
Saved in this browser only.
Design problem
Plan a model with beads that tests this question: does the number of offspring change how close a cross comes to 3 : 1?
One way to do it
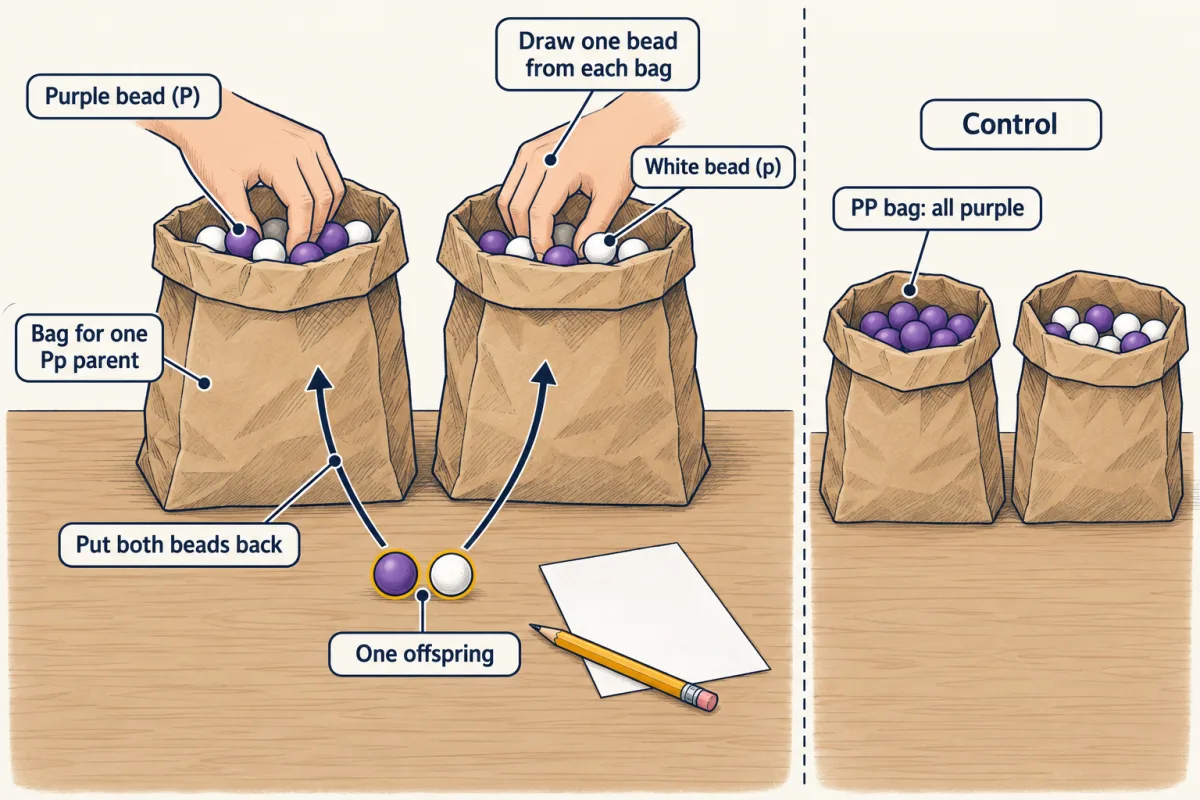
Make two paper bags, one for each Pp parent. Put 20 purple beads (P) and 20 white beads (p) in each bag. All beads are the same size, about 1 centimetre across, so you cannot tell them apart by feel.
- Make one offspring: without looking, draw one bead from each bag. Record the pair, then put both beads back and shake the bags.
- Independent variable: the number of offspring you make: 4, 20 or 100.
- Dependent variable: the percent of offspring that are pp (white).
- Constants: the same bags, the same 20 and 20 beads, and putting beads back after every draw.
- Control: a PP bag (40 purple beads) paired with a Pp bag. It should never give a pp offspring, which checks that your method works.
- Repeated trials: make each group size 5 times and find the mean percent of white.
- Safety: pick up dropped beads so no one slips, and keep beads away from your mouth.
If the 100-offspring groups land closer to 25 percent than the 4-offspring groups, sample size matters. The bead model is not a real plant: it has one gene and no weather, soil or lost seeds.
Evaluate: check your thinking
The white was hiding in the parents’ genotypes. Both purple parents were Pp, so each carried a masked p allele. Each offspring had a 1 in 4 chance of getting p from both parents, and those pp plants bloomed white. A Punnett square predicts that chance, but not the exact count in a small group.
Science practices you used: making predictions and testing them, using a Punnett square as a model and naming its limits, calculating ratios and percents from real counts, and making a claim with evidence and reasoning.
How we measure it
Controlled hand-pollination
The pollen-making parts of a flower are removed before they ripen, and pollen from a chosen plant is brushed on. This way you know both parents of every seed.
Counting offspring by trait
Each seed or plant is sorted into a group, such as round or wrinkled, and each group is counted. Dividing one count by another gives a ratio to compare with a Punnett square.
Finish line
Test yourself
8 questions
Practice and MCAT-style, with explained answers.
Next · Lesson 26
Inherited or Acquired?
How can two cuttings from the same hydrangea bloom blue in one garden and pink in another, and how can a dominant trait be rare?
Continue →