Biology · Unit 4: DNA and inheritance
How the DNA Model Was Built
How did scientists build a model of a molecule too small to see, and how did reading whole genomes change biology? You compare four models of DNA, follow the evidence that led to the double helix in 1953, and read real data on how the cost of sequencing a genome fell. Afterwards you can say what each DNA model shows and hides, and make a claim from cost data.
Where this lesson sits
- Virginia SOL BIO.5b
- Practices BIO.1c, BIO.1d, BIO.1e, BIO.1f
Essential question: How has our model of DNA changed over time, and how did reading whole genomes change biology?
-
Life Science (grade 7) LS.10 a
Review it at grade 7 level
In grade 7 you learned that DNA is a double helix, shaped like a twisted ladder. The sides of the ladder are the same in all living things. The rungs are pairs of bases, written A, T, C and G. The order of the bases forms a code for making proteins, and proteins affect traits. You also learned that many people, over many years, added discoveries that built our current understanding of DNA. Biology adds how that model was built from evidence, and how scientists now read the order of all the bases in a genome.
-
Biology BIO.5b You are here
This lesson
-
Biology II Biology II: Genetics, GEN.7 b
Preview where it goes next
Virginia’s Biology II: Genetics course asks what the Human Genome Project made possible. The project provided data needed to read and edit the human genome. With a reference sequence, scientists can compare a person’s DNA with it and find differences. Those comparisons are used in forensics to match DNA samples, in personalized medicine to choose care that fits a person’s genes, and in genetic counseling to help families understand inherited risks. This lesson left out those uses, and also how editing tools find a target sequence. Each of those depends on first knowing the order of bases in the region being studied.
-
College
Watch first Every DNA Model Leaves Something Out · 2:57
The Human Genome Project spent about 13 years, from 1990 to 2003, reading the DNA of humans. By 2022, the estimated cost to sequence a human-sized genome had fallen to about 525 dollars. Nobody has ever looked at DNA the way you look at a pencil. Most of what we know about its shape and its letters comes from indirect evidence and from models. How was the model of DNA built, and what changed when scientists could read whole genomes?
What do you think? Decide before you read.
-
Scientists disagree: DNA was identified by Friedrich Miescher in 1869, in material from the nuclei of white blood cells. In 1953 Watson and Crick proposed a model of how DNA is shaped. Their model used measurements that other scientists had already made, so it was the result of many people’s work.
What scientists think
Scientists disagree: DNA was identified by Friedrich Miescher in 1869, in material from the nuclei of white blood cells. In 1953 Watson and Crick proposed a model of how DNA is shaped. Their model used measurements that other scientists had already made, so it was the result of many people’s work.
-
Scientists disagree: Every model makes approximations. A flat ladder drawing of DNA removes the twist. A string of letters gives the order of bases but no shape. Scientists choose a model by asking what it is meant to explain, and they keep in mind what it leaves out.
What scientists think
Scientists disagree: Every model makes approximations. A flat ladder drawing of DNA removes the twist. A string of letters gives the order of bases but no shape. Scientists choose a model by asking what it is meant to explain, and they keep in mind what it leaves out.
-
Scientists disagree: The first human reference sequence was a patchwork of DNA from several anonymous donors, with about 70 percent from one person. It works as a reference, a standard to compare against, rather than as a record of any one person. Later projects added sequences from many more people to show how human DNA varies.
What scientists think
Scientists disagree: The first human reference sequence was a patchwork of DNA from several anonymous donors, with about 70 percent from one person. It works as a reference, a standard to compare against, rather than as a record of any one person. Later projects added sequences from many more people to show how human DNA varies.
Explore: compare four models of one molecule
In the simulation you switch between four models of DNA: a flat ladder, a twisted helix ribbon made of blocks, a string of base letters, and a chromosome view. For each model, you tick boxes to show what it can explain: base pairing, copying, how much information DNA holds, and how DNA packs into a cell. The simulation then shows what each model hides.
Flat ladder: pick it, tick the boxes you think fit, then check.
| Model | Pairing | Copying | Information | Packing |
|---|
In this sketch each model is judged by what the lesson says each model shows and leaves out, plus our own reading. Blocks and letters are not to scale, and no atoms are drawn.
Rule to keep: every DNA model shows some features and hides others, so scientists pick the model that fits the question.
Try this.
- Before you open the ladder model, predict which of the four questions it can answer. Then check the boxes and compare.
- Predict which model is best for comparing your DNA with a classmate’s at one gene. Test your choice.
- Switch to the chromosome view. Predict whether you can still see base pairs. Look and explain what you notice.
- Pick the one model you would keep if you could keep only one. Write what you would lose.
Explain: every DNA model leaves something out
- model
- nucleotide
- base pairing
- double helix
- X-ray diffraction
- DNA sequencing
- genome
- Human Genome Project
- chromosome
- reference sequence
A model is a simplified representation that helps explain or predict something real. A city map is a model: it shows streets but not the people on them.
DNA is built from units called nucleotides. A nucleotide is one building block of DNA, made of a sugar, a phosphate group and a base. DNA has four bases, written A, T, G and C. The order of the bases carries the instructions, as the DNA structure lesson shows.
Each common model of DNA is good at one job:
| Model | Good for showing | Leaves out |
|---|---|---|
| Flat ladder with letters | Which bases pair, and the two backbones | The twist, and all the atoms |
| Double helix ribbon | How two strands coil around each other | Individual atoms, and often the actual base order |
| Base-letter string (ATTGC…) | The order of bases, for comparing DNA | Shape, size and the partner strand |
| Space-filling model | How much space the atoms fill | Base pairs hidden inside the molecule |
These are four pictures of one substance, not four kinds of DNA. The map analogy breaks down in one way: a map is drawn from a place you can visit and see. A DNA molecule is only about 2 nanometers wide, far too narrow to see with your eyes or a light microscope, so DNA models are built from measurements.
Explain: three kinds of evidence, one model
DNA was identified in 1869, long before anyone knew its shape. By the early 1950s, scientists had three kinds of evidence to work with.
- Base amounts. Chemists broke DNA into its bases and measured each one. Erwin Chargaff’s group found that in a DNA sample, the amount of A is close to the amount of T, and G is close to C. Other teams showed that the four bases do not simply come in equal amounts in every species.
- X-ray patterns. In X-ray diffraction, X-rays shone through lined-up DNA fibers scatter into a pattern of spots on film. Rosalind Franklin and Raymond Gosling measured such patterns, including one often called Photo 51. The spacing of the spots pointed to a helix about 2 nanometers wide, with phosphates on the outside. The pattern gave shape clues, not a photograph of the bases.
- Model building. James Watson and Francis Crick fitted these facts together with the known chemistry of the parts. Their paper said they had been stimulated by knowing the general nature of unpublished results and ideas from Maurice Wilkins, Franklin and their coworkers at King’s College London.
The result, published on 25 April 1953, was the double helix: two strands of DNA coiled around each other, running in opposite directions, with the backbones outside and bases inside. Base pairing is the rule that A pairs with T and G pairs with C across the two strands. That rule explained the equal amounts of A and T. It also suggested how DNA could be copied, because each strand fixes the order of its partner.
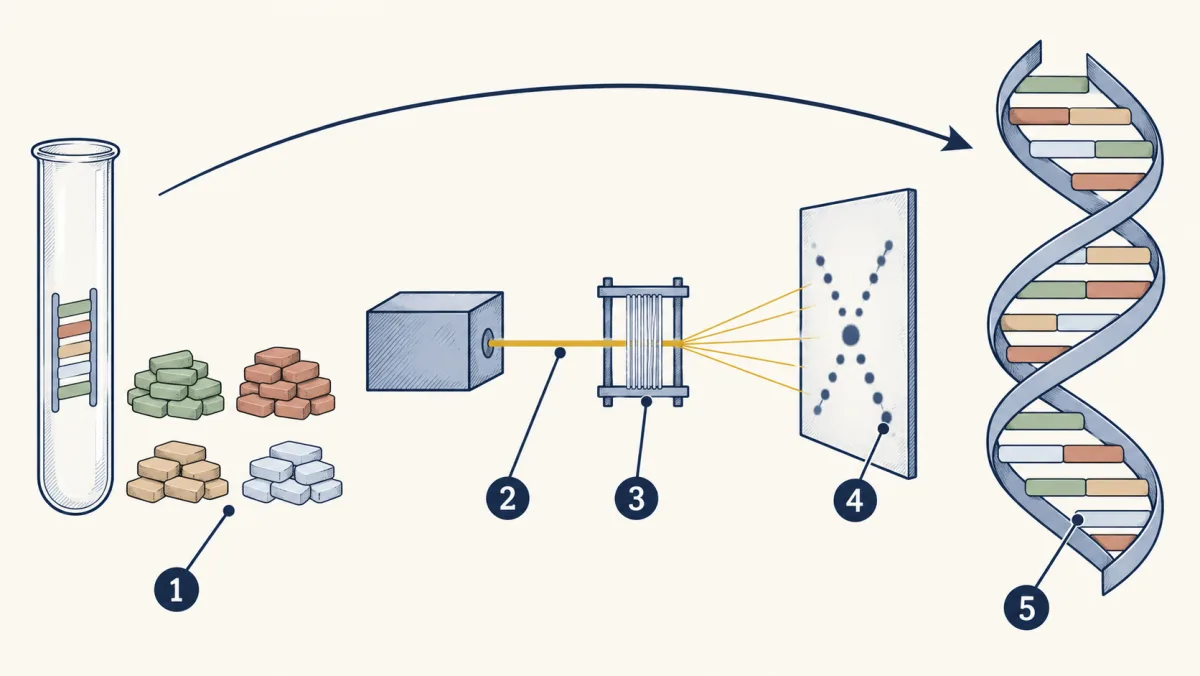
- Base amounts
- X-rays
- lined-up DNA fibers
- pattern of spots
- double helix
- blank
- X-rays
- blank
- blank
- double helix
Word bank: Base amounts, lined-up DNA fibers, pattern of spots
- blank
- blank
- blank
- blank
- blank
Check your labels
- Base amounts
- X-rays
- lined-up DNA fibers
- pattern of spots
- double helix
The authors were careful. Watson and Crick called their model unproved until it could be checked against more exact results. Franklin and Gosling called a helix highly probable. Later experiments tested the model and supported it.
Explain: reading the letters since 1977
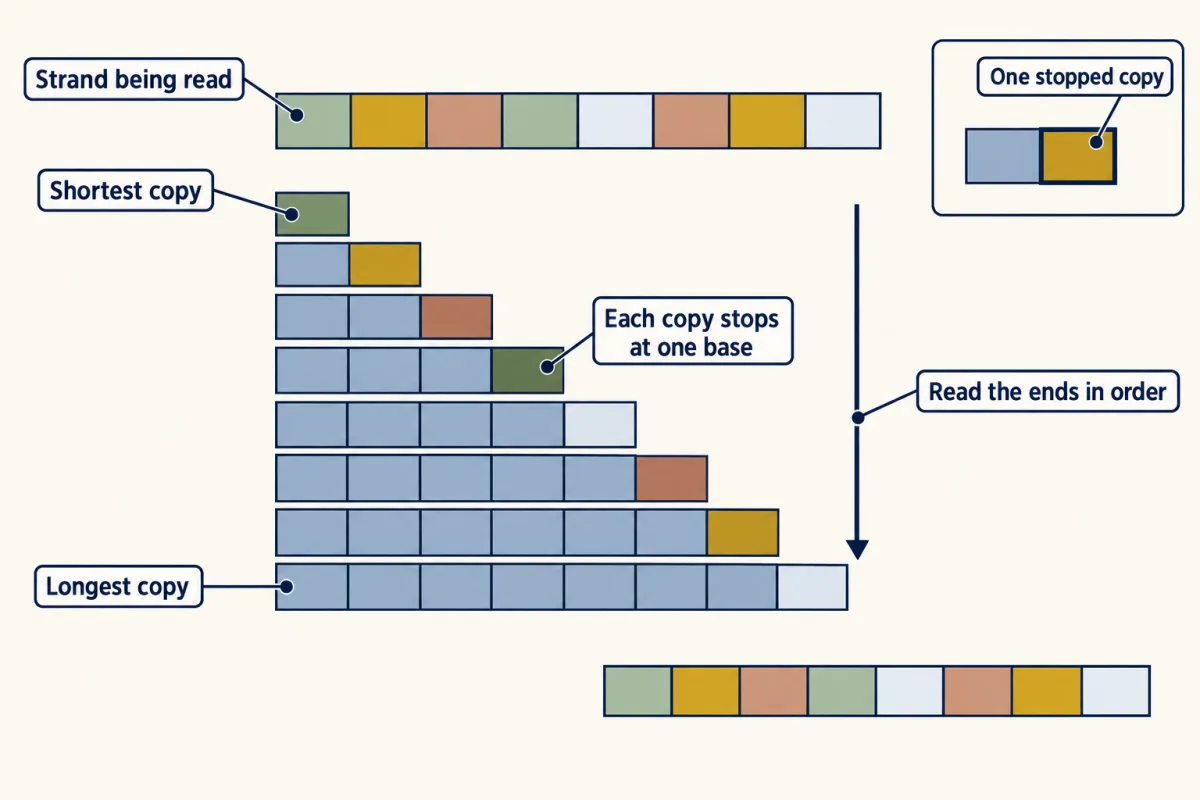
Knowing the shape did not tell anyone the order of the bases. DNA sequencing is any method that reads the order of bases in a piece of DNA. In 1977 Frederick Sanger and his colleagues published a method that stops copies of a strand at each kind of base. The lengths of the copies reveal the base order.
A genome is all the DNA in one set of an organism’s chromosomes. A chromosome is one long DNA molecule wound with proteins. A human genome has about 3 billion base pairs.
The Human Genome Project was an international project, from October 1990 to April 2003, that read the order of bases in human DNA. It mostly used improved Sanger sequencing. Human chromosome 22 was the first finished human chromosome, published in 1999. The project produced a reference sequence, a standard human DNA sequence that other sequences are compared against. It was pieced together from several donors, and it still had gaps.
Newer methods kept going. In 2022 a team reported a human sequence with no gaps in the 22 numbered chromosomes and the X, and a finished Y followed in 2023. In 2023 another team released a draft “pangenome” built from 47 people, to show how human DNA varies. The double helix model still holds. Sequencing added the letters, how many there are, and how they differ between people.
Elaborate: the falling cost of a genome
| Date | Estimated cost per human-sized genome (US dollars) |
|---|---|
| September 2001 | 95,263,072 |
| October 2003 | 40,157,554 |
| October 2007 | 7,147,571 |
| January 2008 | 3,063,820 |
| January 2010 | 46,774 |
| April 2012 | 5,901 |
| July 2015 | 1,363 |
| May 2019 | 606 |
| August 2021 | 562 |
| May 2022 | 525 |
These values come from the National Human Genome Research Institute (NHGRI) “Cost per Genome” data table, May 2022 version (genome.gov). They are production costs at NHGRI-funded sequencing centers, scaled to a genome of 3,000 million bases. They leave out the cost of interpreting the DNA, and they are not prices a person pays. For comparison, NHGRI reported the whole U.S. part of the Human Genome Project at about 2.7 billion dollars, counted in 1991 dollars, which paid for much more than sequencing.
- Between which two neighboring dates did the cost fall the most, compared with its starting value?
- About how many times cheaper was May 2022 than September 2001?
- Compare 2019 to 2022 with 2008 to 2010. What do you notice about the recent change?
Claim, evidence, reasoning
Make a claim that answers the essential question: how did reading whole genomes change what biologists can study? Use this data.
Start with: The data show that the cost of sequencing a genome blank, so biologists can now blank.
Start with: In September 2001 one genome cost about blank, but by May 2022 it cost about blank.
Start with: If each genome costs less, the same budget pays for blank genomes, which lets scientists compare blank.
Compare with a model answer
The cost of sequencing a human-sized genome fell so far that biologists can now compare many genomes instead of one reference. In September 2001 NHGRI estimated about 95 million dollars per genome. By May 2022 the estimate was about 525 dollars, roughly 180,000 times cheaper. In this table, the steepest fall came between early 2008 and early 2010, from about 3 million dollars to about 47,000 dollars. With a fixed budget, a lower cost per genome pays for many more genomes, so scientists can compare DNA across many people and species. One limit: these are production costs from funded sequencing centers only, and they leave out the cost of analyzing the data.
Saved in this browser only.
Design problem
Sequencing machines read short pieces of DNA, and a computer joins overlapping pieces back together. Repeated stretches make this hard. Plan an investigation with paper strips to test whether longer pieces make it easier to rebuild a sequence that contains a repeat.
One way to do it
Write a 60-letter made-up DNA sequence that contains the same 8-letter stretch twice. Make several copies and cut them into overlapping strips.
- Independent variable: strip length, such as 6, 12 and 20 letters.
- Dependent variable: whether a classmate who has not seen the original rebuilds it correctly, and how long it takes.
- Constants: the same original sequence, the same number of copies, and a cut at random places each time.
- Control: a version with no repeated stretch, cut into 6-letter strips, to show the puzzle is solvable without a repeat.
- Trials and sample size: at least five classmates for each strip length, each working alone.
If short strips often give the wrong order around the repeat while 20-letter strips do not, longer reads help. This is one reason long-read methods helped fill gaps in 2022. A limit: paper strips have no reading errors, and real sequencers make some.
Evaluate: check your thinking
The human genome took about 13 years to read partly because the methods of the time were slow and costly. New sequencing technology cut the estimated cost from about 95 million dollars in 2001 to about 525 dollars in 2022. The double helix model from 1953 still holds, and cheap sequencing now lets biologists compare the DNA of many people and species.
Science practices you used: comparing models and naming their limits, tracing how evidence built a model, reading a data table and calculating a ratio, and planning a fair test with repeated trials.
How we measure it
X-ray fiber diffraction
X-rays are shone through a bundle of lined-up DNA fibers, and the spots they make on film are measured. The spacing of the spots gives clues to repeat distances and overall shape, but it does not show the order of the bases.
Base-composition analysis
DNA is broken into its bases with acid, and the amount of each base is measured. Comparing the amounts tests ideas about how the bases are arranged, such as whether A and T come in equal amounts.
Sanger chain-termination sequencing
An enzyme copies a DNA strand while special building blocks stop each copy at a known base. Sorting the copies by length reveals the base order, one letter at a time.
Finish line
Test yourself
8 questions
Practice and MCAT-style, with explained answers.
Next · Lesson 18
From DNA to Protein
How can changing one letter out of hundreds in a gene make red blood cells bend into stiff sickle shapes?
Continue →